Mouse click heatmap is an analytics tool for experienced internet marketers, web designers, content managers, and SEO specialists. It captures how visitors navigate a website and what elements they click on. The user behavior insight helps understand visitors’ problems and immediately eliminate them, making mouse movement tracking software an essential CRO solution.
What is a Mouse Move Tracking Heatmap?
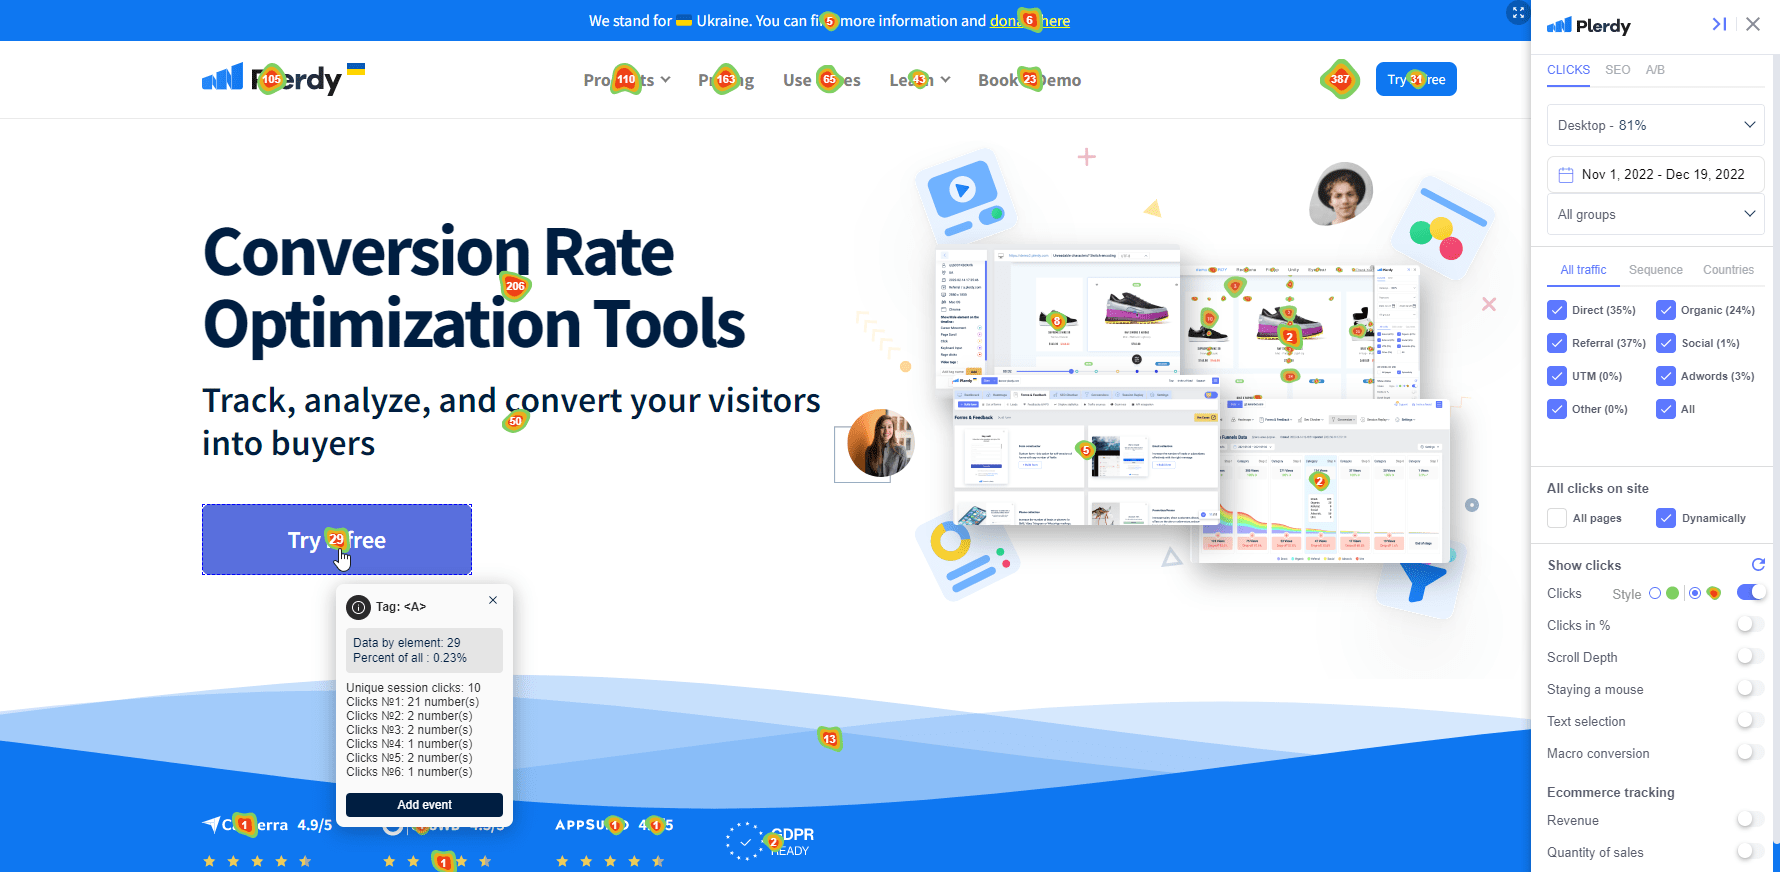
Mouse move tracking heatmap is a specialized tool that records user interactions with pages. This software collects mouse clicks and moves them to display them on maps updated in real-time. Mouse move heatmaps use the color-coding scheme for visualization and convert the recorded mouse data into colors. The hotter the color, the more users interact with this area. Such a visual representation is very convenient for evaluating the activity without diving into statistical analysis quickly.
In particular, mouse heatmap tools can:
- Detect typical user activities and anomalies
- Show the most clicked elements in real-time
- Help optimize traffic flow and reduce bounce rates with reliable mouse click tracking data
Usability Testing: Tips and Examples:
Mouse movement tracking is based on the idea that the mouse cursor repeats eye movement. This lets you get into users’ minds and understand how they perceive the content. The information on clicks adds additional value to the mouse movement data by showing the exact places visitors interact with. For example, you may find that most visitors skip the introduction, ignore links, or don’t click specific buttons.
The Importance of Mouse Click Heatmaps
Mouse click heatmap software has multiple applications. It will come in handy for anyone engaged in e-commerce or digital businesses. Since every website is unique, visitors will behave differently based on numerous factors, including personal needs, interests, usability, calls-to-action, ease of navigation, etc. You cannot predict the reaction to the chosen design with 100% accuracy, but you can use heatmaps to see how visitors react.
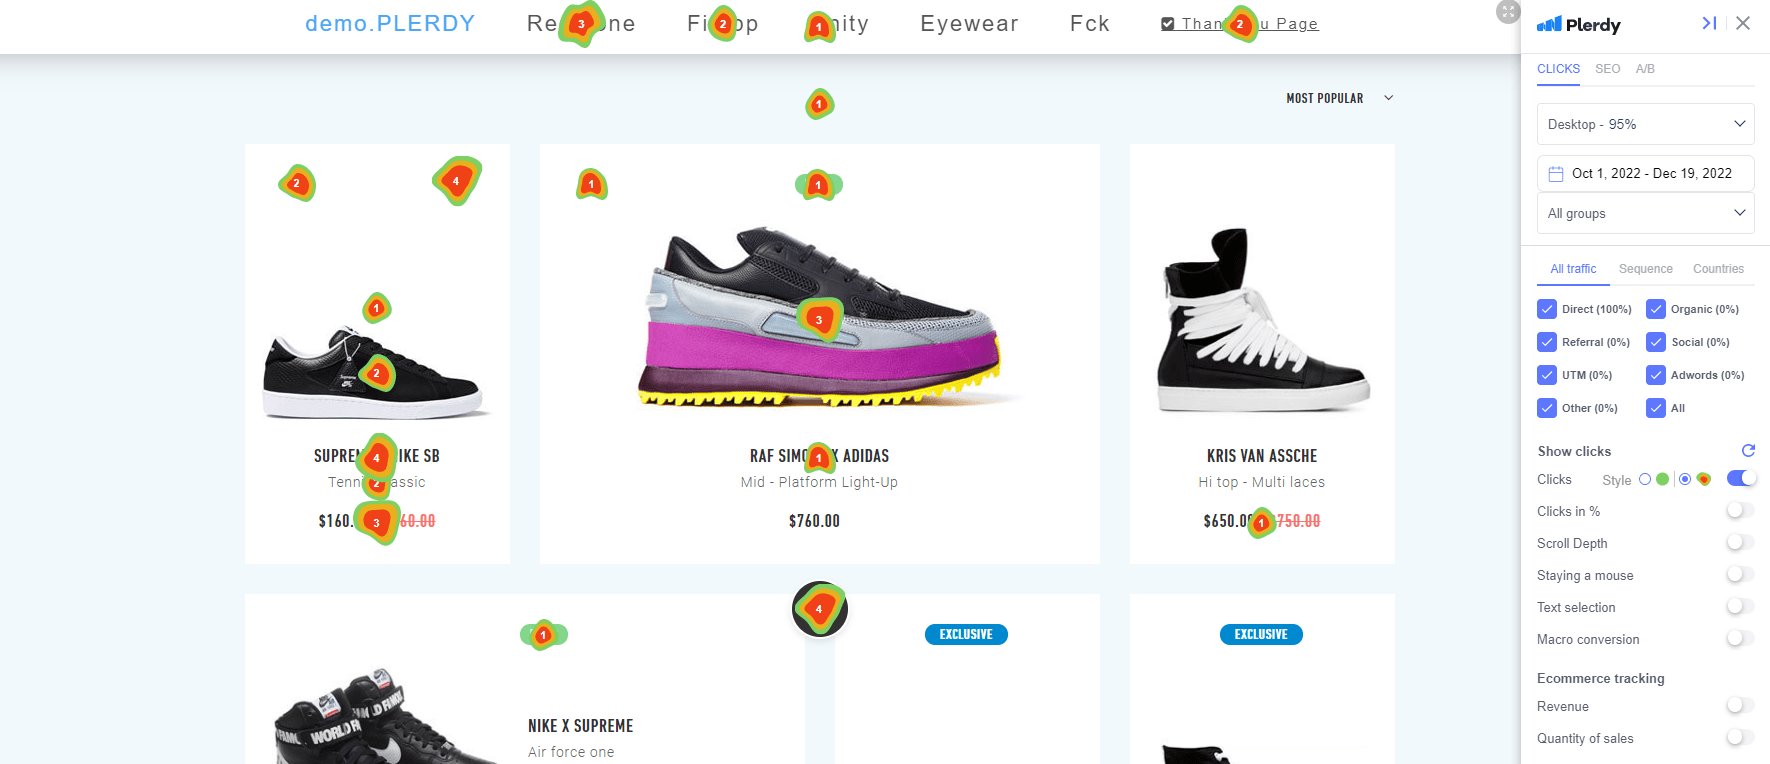
Long story short, heatmap software is a must-have for any modern website to stay competitive. The market is so oversaturated that only a website with smooth navigation and ultimate user experience can generate decent sales.
Click map vs. Heat map
Before adopting heatmap software, let’s clarify the difference between click and heat maps. A heatmap is a more generic term that describes various maps offering visual website analytics. It’s a color-based representation of different user activities.
Click tracking maps are a subtype of heatmaps (+ scroll and mouse move maps) in which red dots represent the most frequently clicked elements, while blue spots represent the least popular ones. Heatmap solutions usually include click maps as one of the functions.
Advantages of Plerdy Mouse Click Heatmap
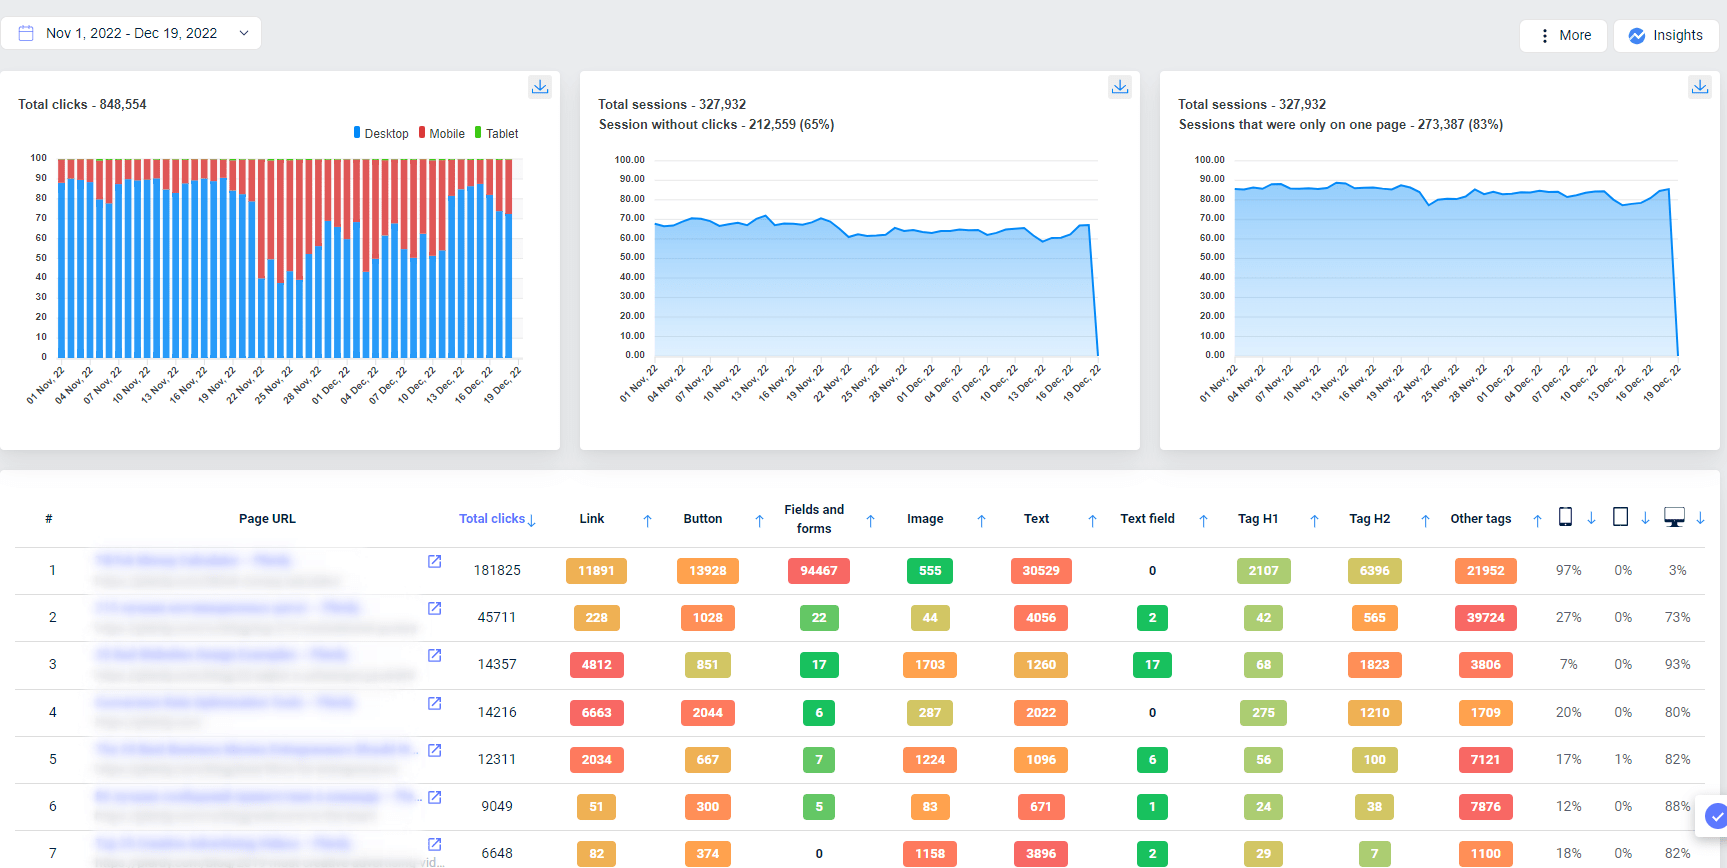
The mouse clicks heatmap tool is a classic tracking software that records clicks and mouse movements. The Plerdy mouse click tracking tool was designed by a team of specialists with considerable experience in search engine optimization. Therefore, it’s simple and perfectly suited for marketers.
The other benefits of Plerdy mouse click tracking include:
- 99% accuracy. Plerdy heatmaps utilize a custom algorithm that works equally well on desktop and mobile devices. You can rely on the collected mouse data to make critical redesign decisions.
- Real-time monitoring. The tool instantly transfers data to website maps and dashboards, saving time and allowing you to fix any user experience issues proactively.
- Statistics on a live website. Unlike many heatmap tools that provide screenshots of website pages, Plerdy is live streaming. You can view the latest data while navigating the analyzed website.
- Plerdy records only important interactions. It doesn’t record empty mouse clicks and other useless interactions, letting you focus on meaningful heatmap statistics.
- Visitor segmentation. The heatmap tool segments website visitors by device type and traffic source to analyze the quality of the target audience.
- Aggregated data. Heatmap data isn’t personally identifiable, so user security and regulatory compliance are guaranteed.
- Multiple tools are available. Subscribing to Plerdy heatmaps, you can access session replay software, customizable pop-ups, NPS surveys, ecommerce analytics, event tracking, and funnel analysis.
- Affordability. Plerdy Heatmaps has several subscription plans to suit every business, whether a startup or an enterprise.
Moreover, Plerdy offers a trial mode for all subscriptions. Studying the heatmap software’s functionality before choosing a paid plan is a significant benefit.
How to Analyze Website with Tracking Mouse Heatmap Tool
Here are quick guidelines on using mouse heatmaps for website analytics. Follow them in your project:
1. Use a mouse click tracking heatmap for redesign
To redesign a website, discover how leads behave. Without this, any significant change may be counterproductive. You risk losing loyalty, which is challenging to regain.
Web designers should examine user behavior before making the first sketches. It’s important to determine which elements are clicked the most and the least to decide whether to keep them.

Pay attention to interactions with the most visited pages and the main pages of every type.
Note that the behavior of desktop and mobile website visitors significantly differs, and the number of mobile users is steadily growing. Therefore, obey the needs of mobile visitors in the next website version.
2. Improve content
Optimize text, images, and videos since they strongly affect traffic and engagement, especially in online stores, where quality content is crucial for conversion increase.
So, how do we enhance website content?
Combine the heatmap tool with a scroll map for more details. Check where users click and how far they reach. It may turn out that a large part of your page gets no attention, articles are overlong, or there are too many products on category pages.
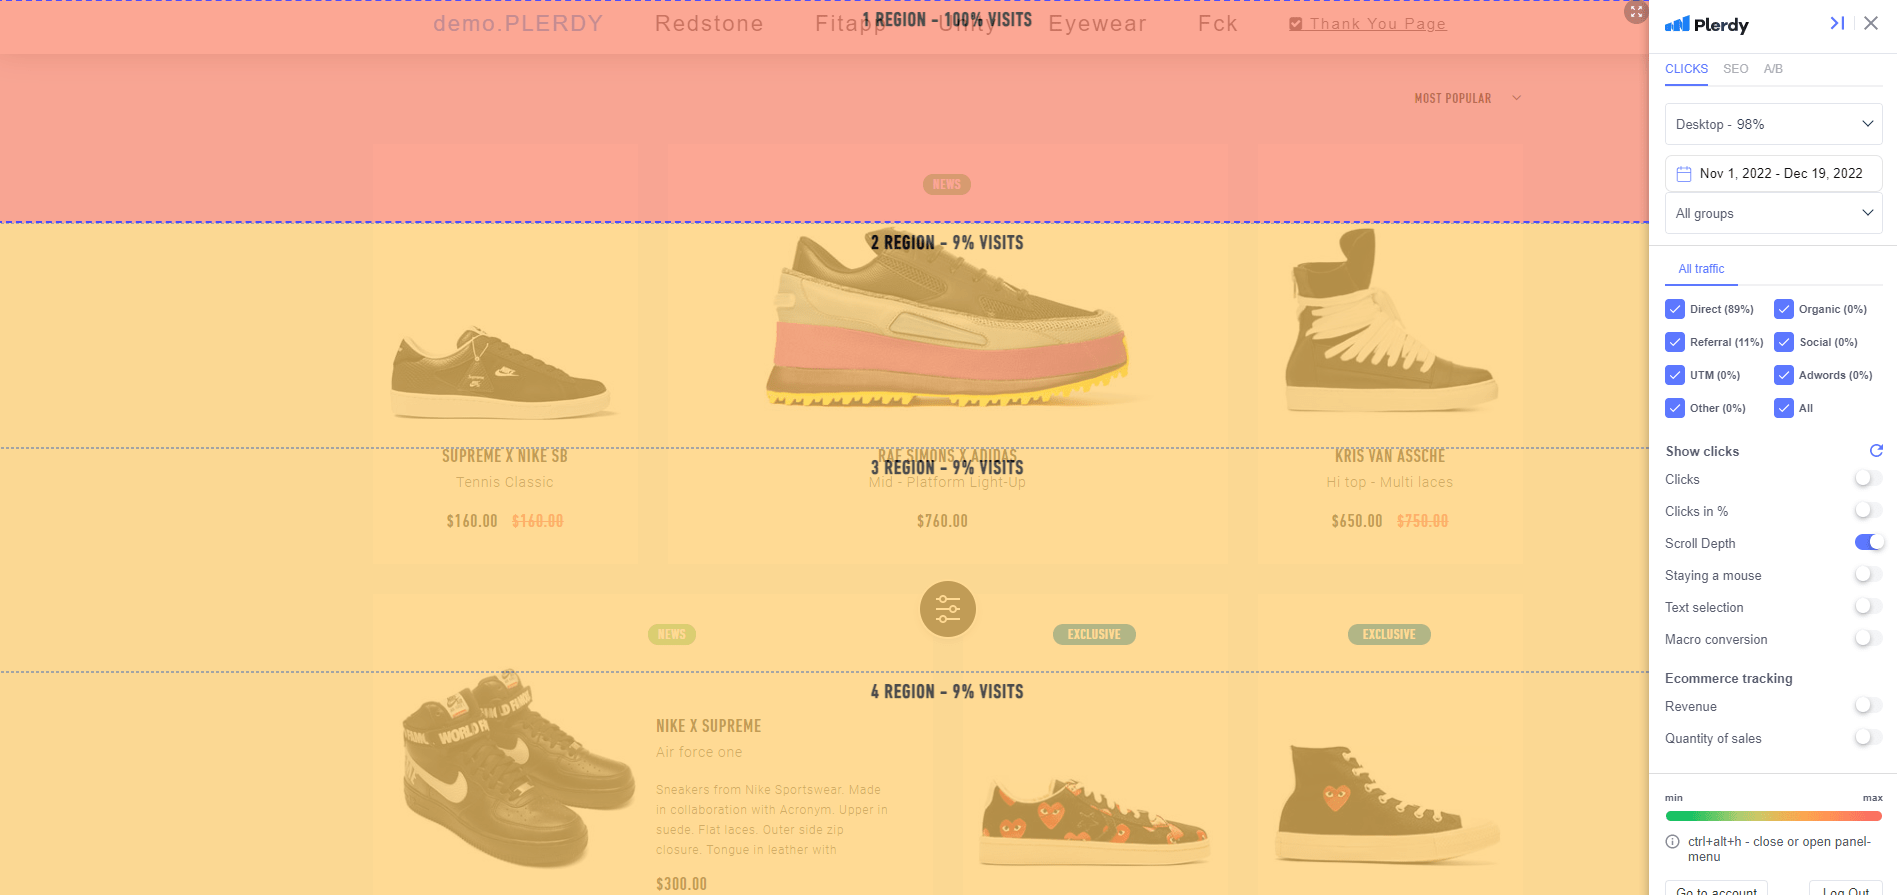
The collected information will guide you in locating CTAs and buttons in the places where they are the most effective.
Besides, the scroll data will help you evaluate the efficiency of long texts. If users don’t read them, consider rewriting or shortening the content.
If the key CTA is located below the article users don’t usually finish, move it to a more popular text block or turn it into a website pop-up banner.
3. Correct the location of links with a mouse movement heatmap tool
Internal linking is fundamental for website promotion. To get more traffic, pages must link to each other. The location of these links is another important factor.
If readers don’t navigate to other articles or product pages, this doesn’t necessarily mean they are not interested in the content. Maybe, the links are hard to notice, or other elements steal the show.
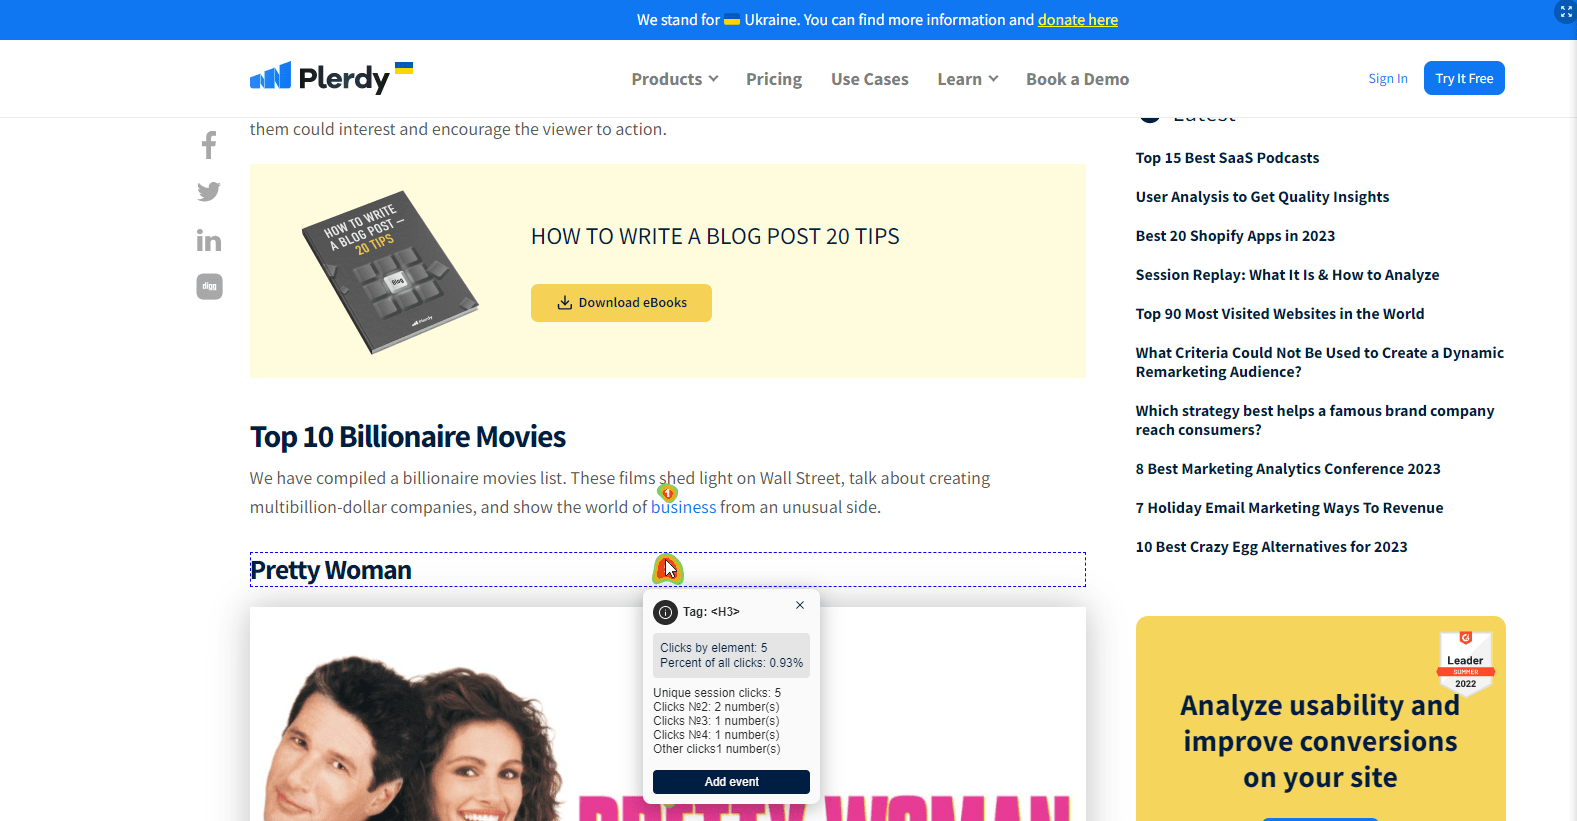
4. Run usability audits with a mouse click heatmap tool
Audits help evaluate design usability objectively. See the website from the users’ perspective and detect behavior anomalies to understand why they don’t complete predicted actions. A usability audit can explain low sales if you run an online store.
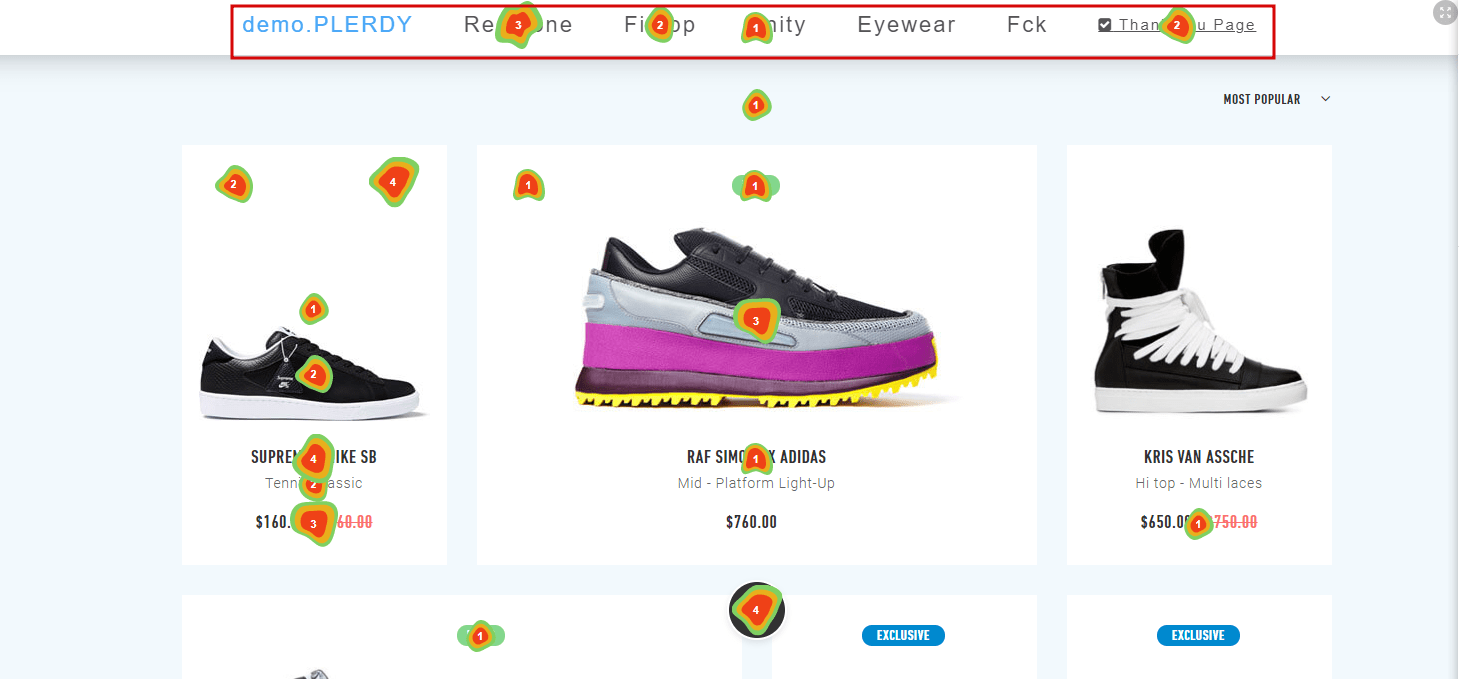
When internet marketers use a heatmap to analyze a website for the first time, they are often surprised. Visitors have a different perception of the design and unexpected preferences. That’s why the usability audit is a mandatory step in website optimization.
5. Evaluate pop-up effectiveness
Many modern websites use pop-ups to hook readers and connect chatbots to stay in touch with prospects.
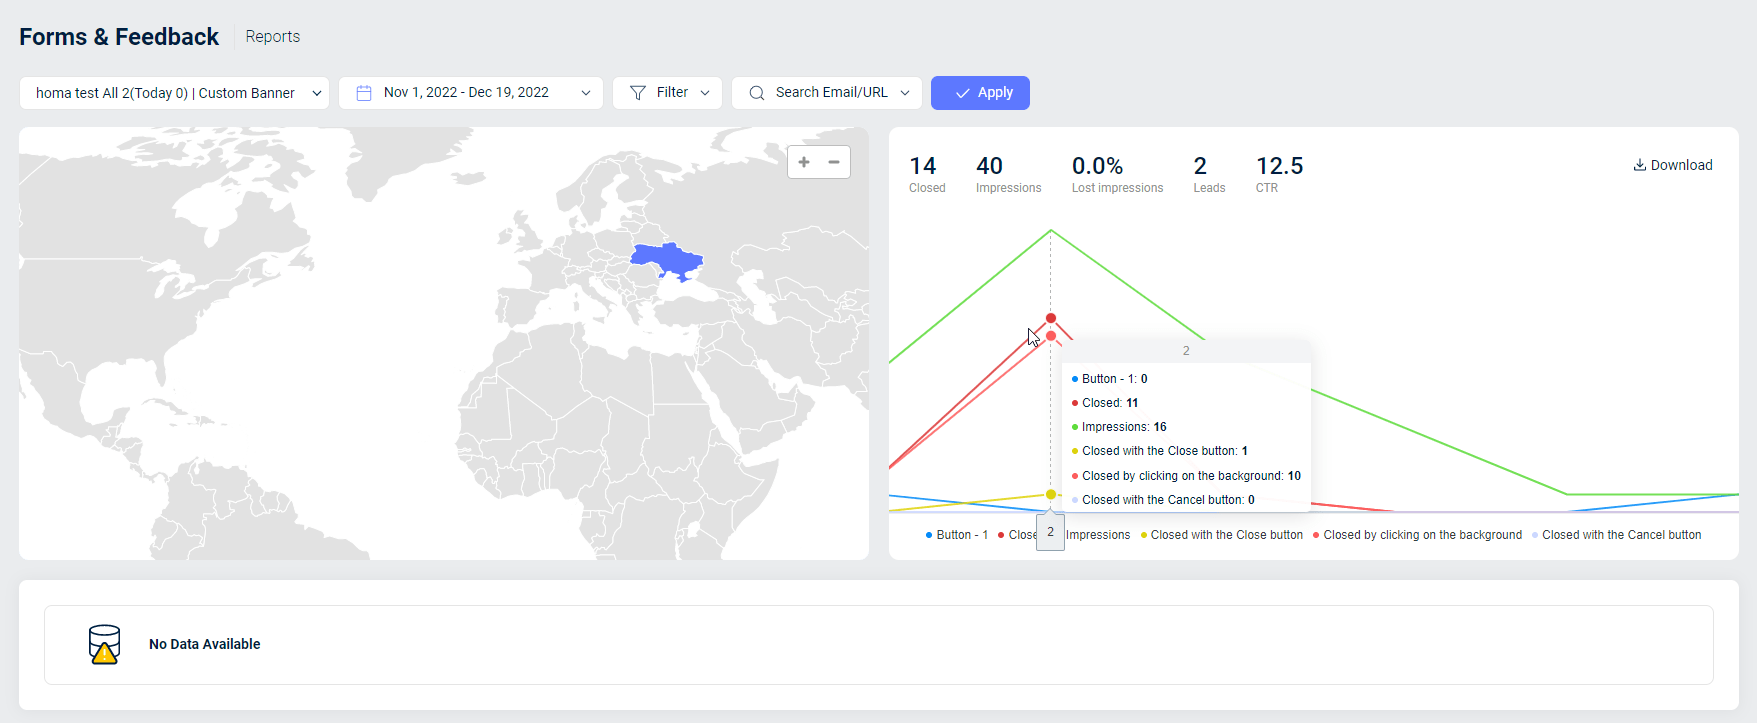
Unfortunately, tracking dynamic website elements is challenging for most heatmaps and applications. It’s hard to tell whether they influence conversion and sales growth.
But not for Plerdy. This tool records interactions with all pop-ups and dynamic elements (menus, banners, chats).
6. Conduct a CTA analysis with a mouse movement heatmap
What makes a user go through the purchase funnel and buy the chosen product? Interest and desire. Someone motivated with convincing calls-to-action quickly completes all the stages.
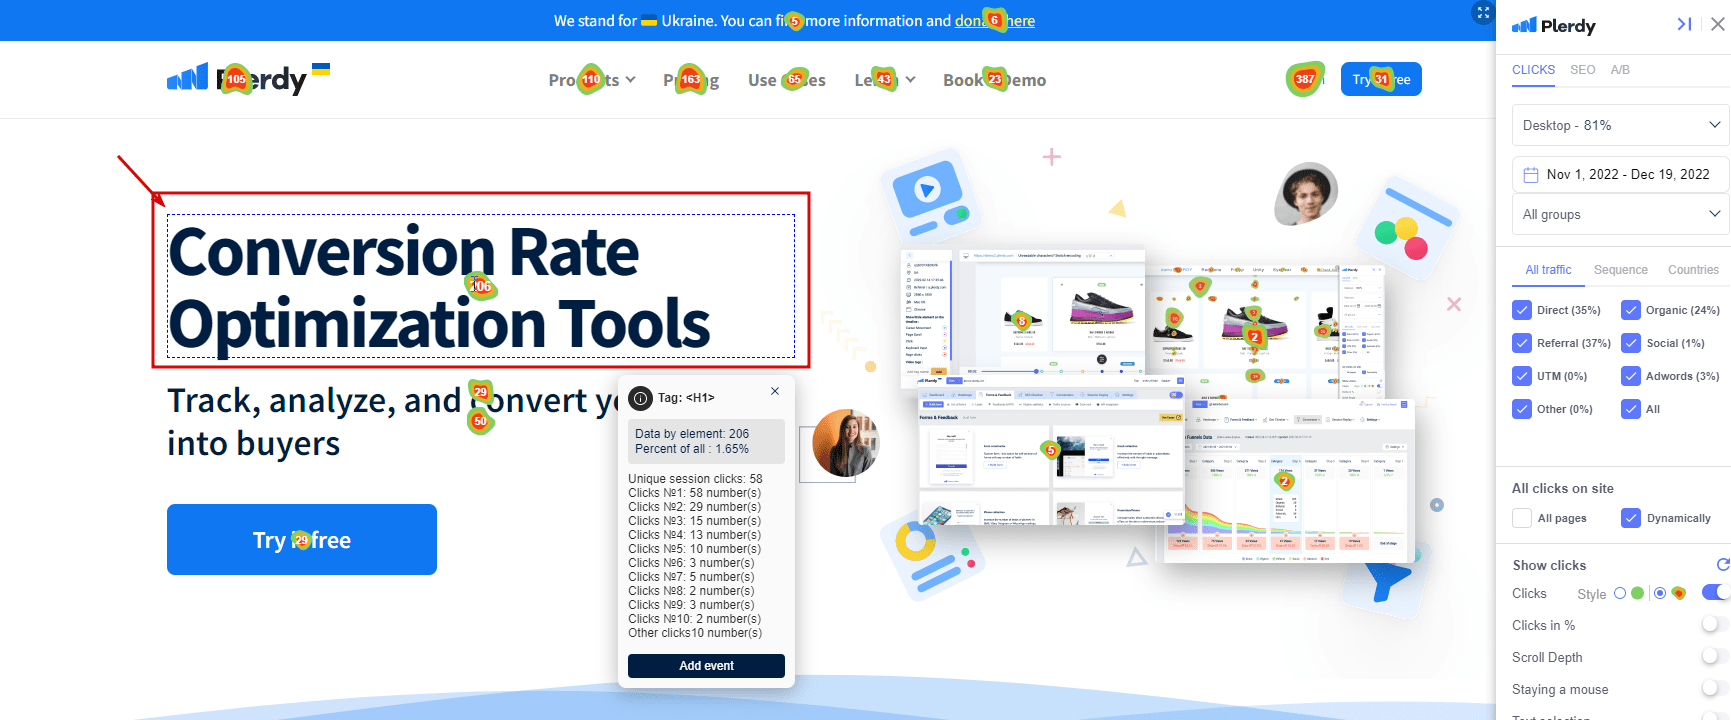
An internet marketer’s task is to create nonintrusive CTAs that nudge users into ordering. To know whether people react to CTAs, record their navigation path and interactions with a move-tracking heatmap.
7. Reduce bounce rates
Many e-commerce marketers find the bounce rate a pain point. So why do users leave a full cart at the last stage of purchasing?
There are many valid reasons to behave like this: a registration form that is too complicated, technical bugs, expensive delivery, or no support.
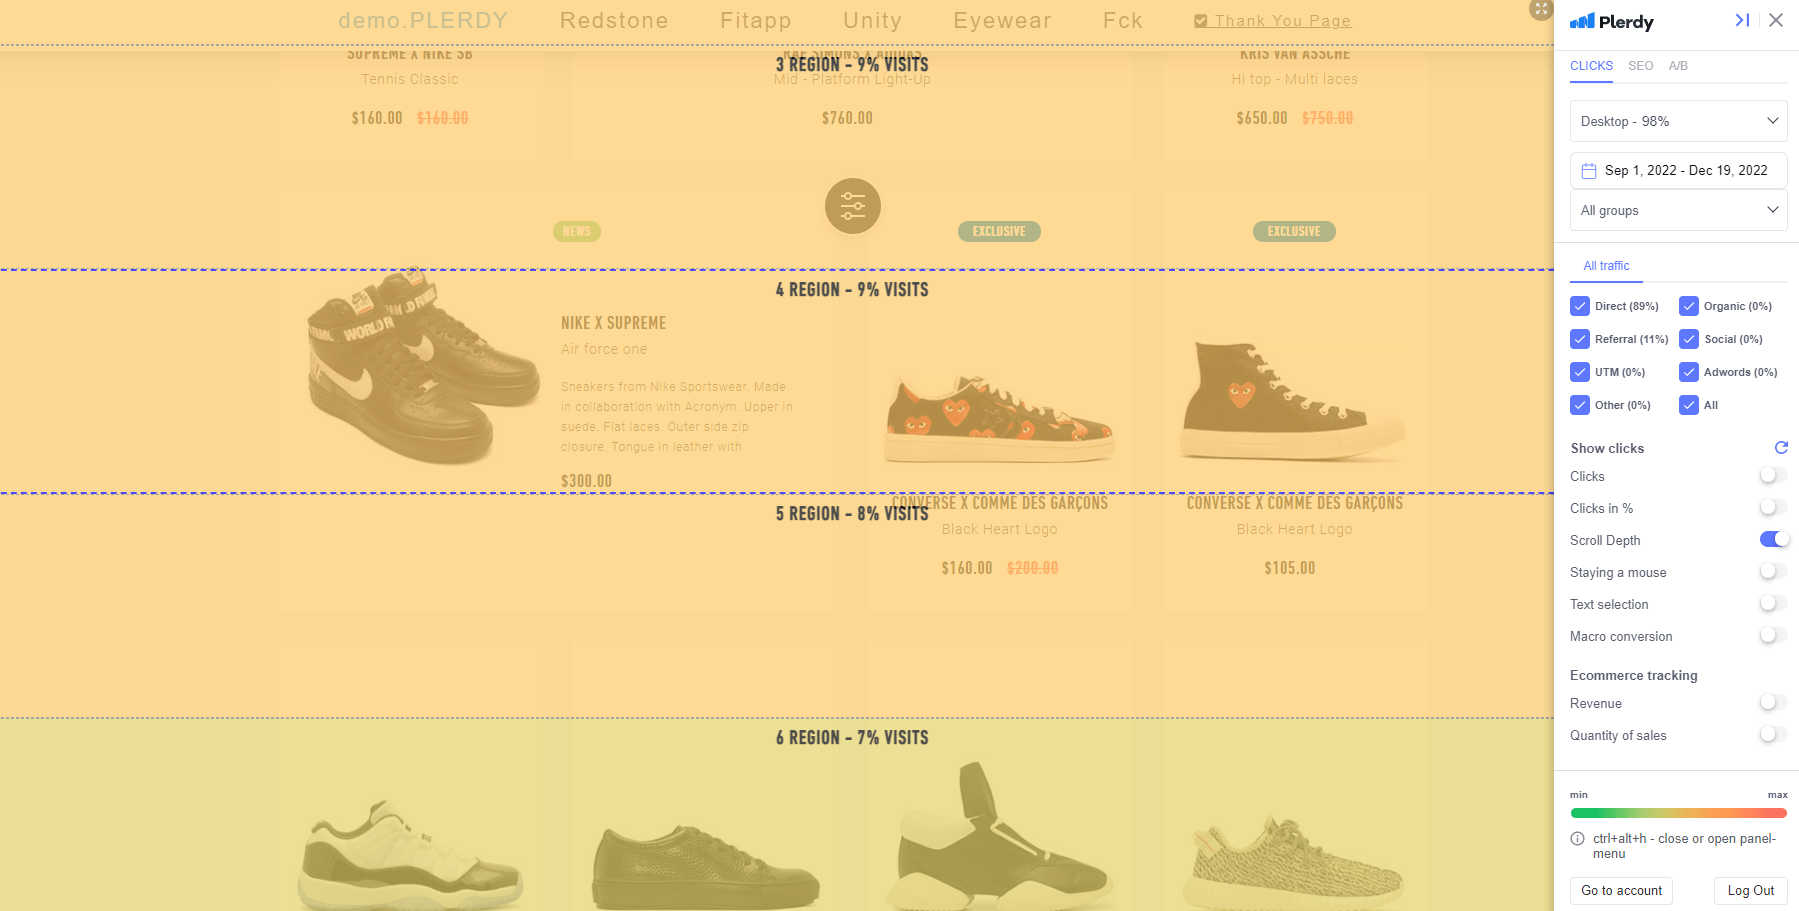
Use a scrolling depth heatmap to detect the real reason behind high bounce rates. The collected data can clarify why users hesitate and what offer can remarket them.
8. Analyze the landing page with a mouse click heatmap tool
A landing page contains all the necessary information about the offer. Usually, a landing page consists of a few blocks with many images, videos, and, sometimes, 3D animations. Users scroll until they encounter a link or block they want to learn more about. If it doesn’t happen, they close the page.

Accurate click data allows you to discover at what point visitors flee. Once you know the problem, a few fixes can prevent bouncing.
9. Increase online store conversions
Besides traditional analytics and online store promotion tools, marketers use mouse-tracking heatmaps and scroll maps to boost conversion.
Conversion is the final action users should take (e.g., place an order, subscribe to the tool, submit a form, etc.). Different ways to increase conversion rates include a unique offer, a usable and understandable design, and properly located CTAs.
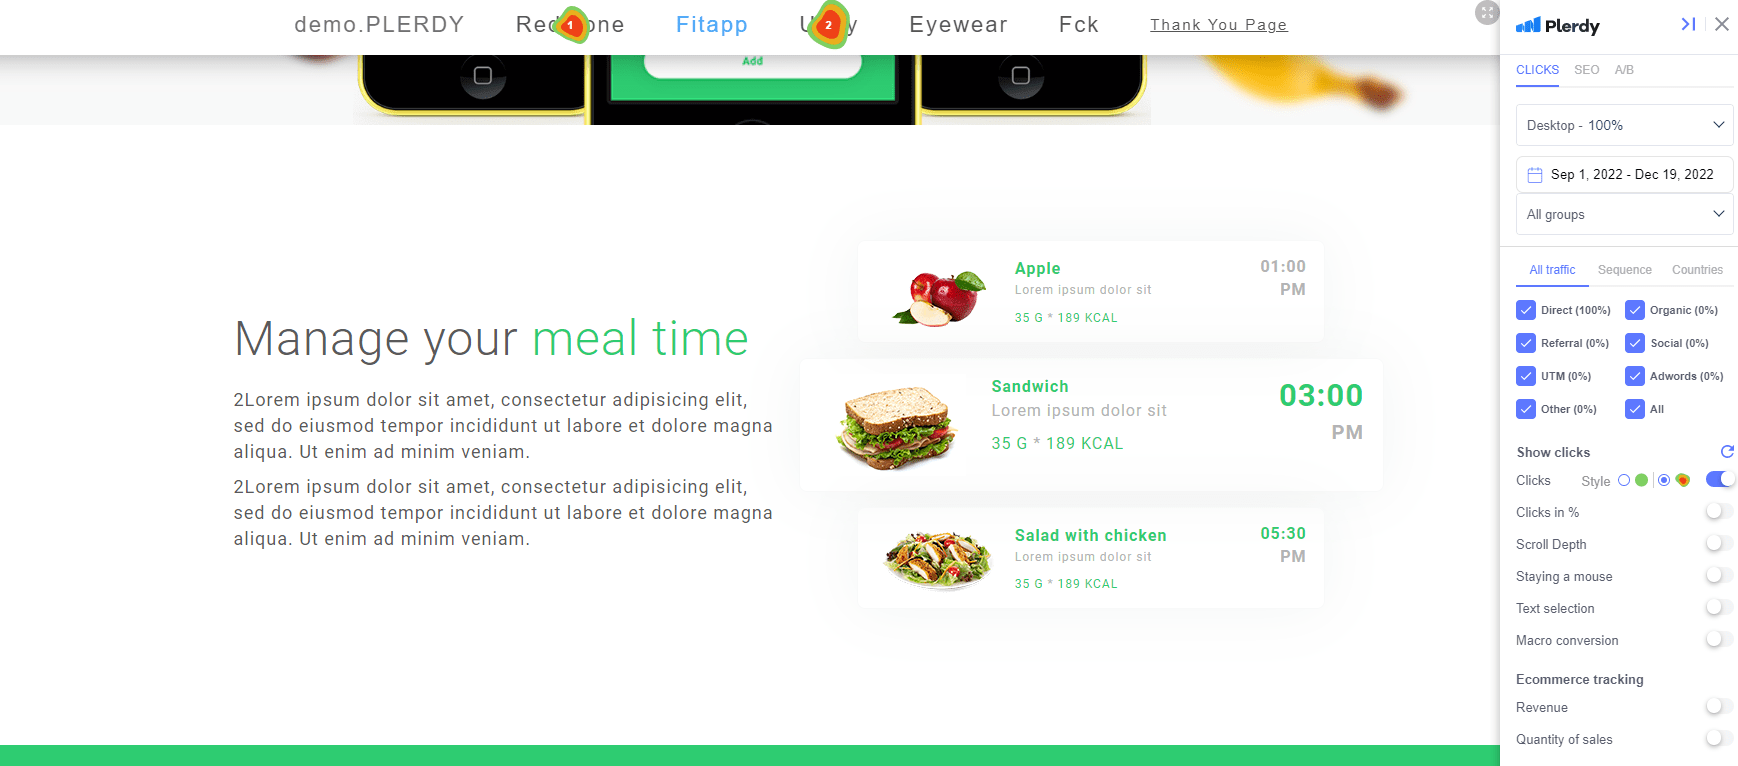
Use a move tracking heatmap to see if the chosen method yields the expected result. Analyze the behavioral factors on online store’s pages and check what users click and read. Then, it will be easier to introduce the right website changes.
10. Analyze unique offers with a mouse click heatmap
Many online stores offer special offers during holidays or sales. They have a unique format, content, and purpose.
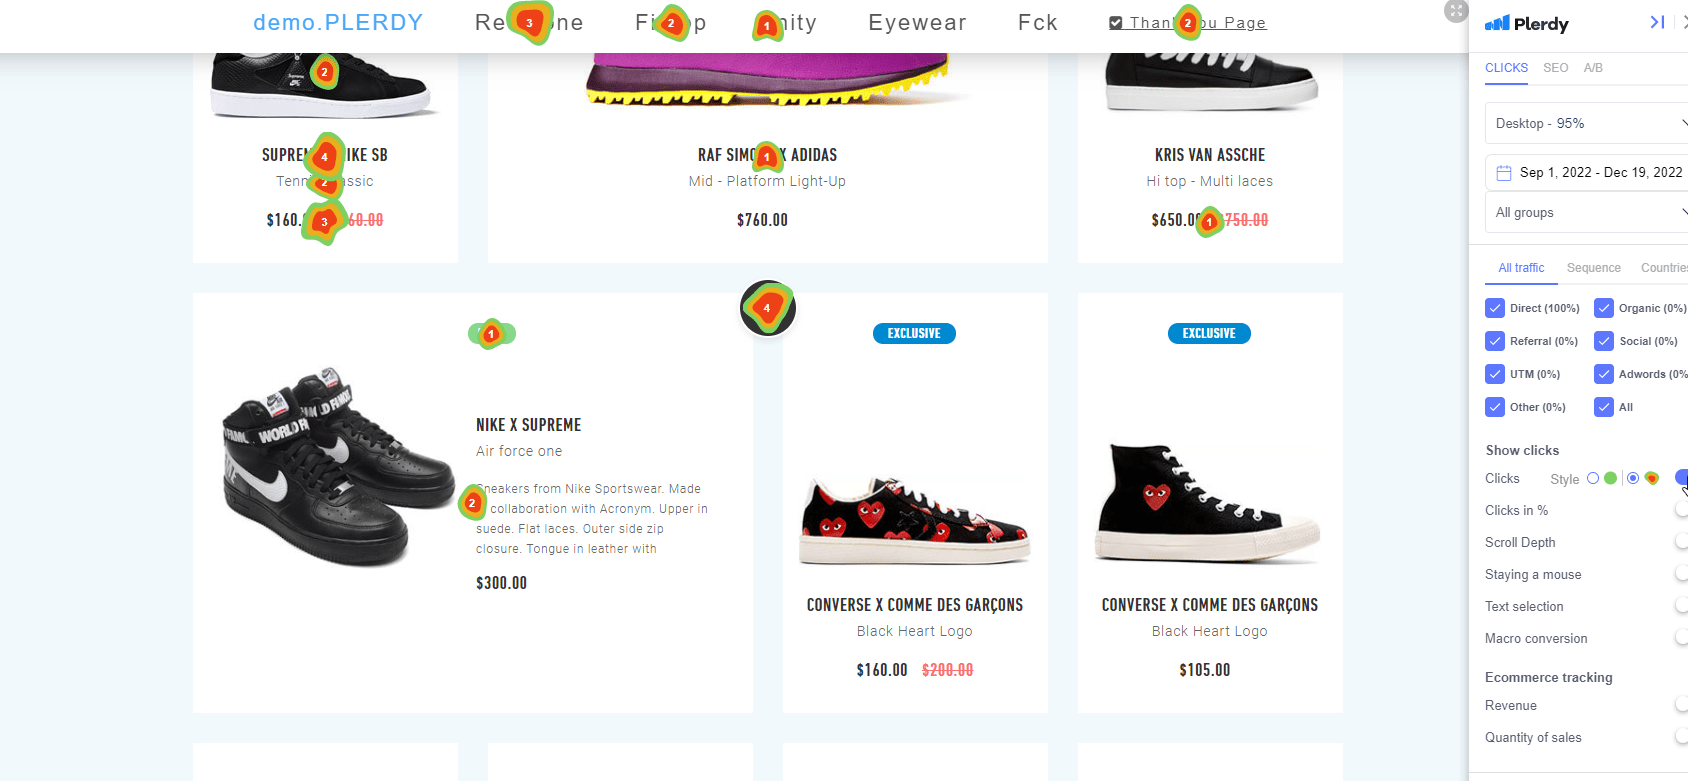
A mouse-click heatmap allows you to analyze special offers on a website. You can view the clicks on the offer and monitor the popularity of the related product or category pages to check whether the discount works.
11. Evaluate the effectiveness of a CMS tool with a mouse movement heatmap
A move-tracking heatmap is an irreplaceable tool for CMS evaluation.
Many web resources are built with CMS systems for extra flexibility and scalability. However, since the popularity of content management systems is growing, different studios provide multiple solutions for website administration.
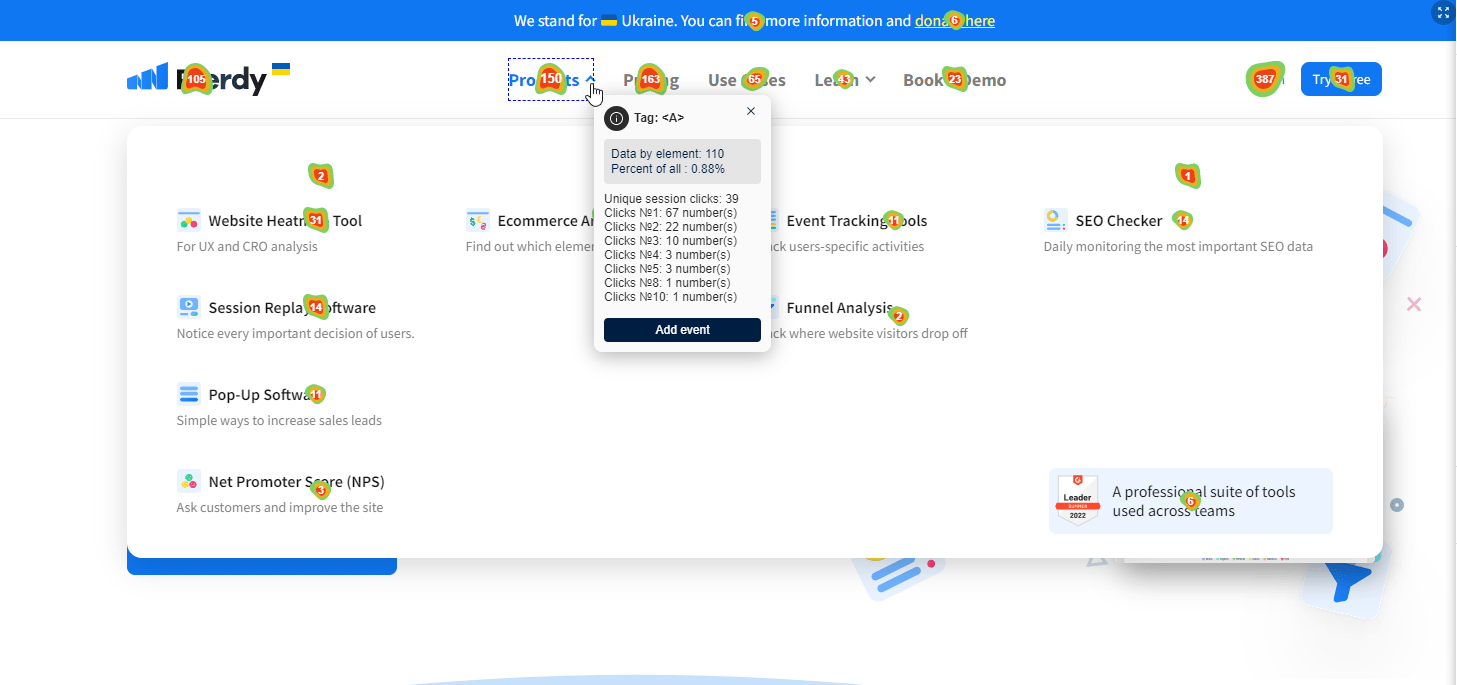
But how do you know which design elements supported by CMS users find convenient?
The problem is that all CMS systems are closed for scanning by external services. Instead, you can collect feedback manually or run a usability audit with mouse move tracking and scroll map tools. The second option is simpler and faster, of course.
12. Detect the sequence of clicks for additional info on user navigation
Sequence tracking shows in what order users click design elements to shorten their conversion path. You can see where they start to figure out what attracts their attention. Or double-check interactions with unnecessary items to eliminate or move them.
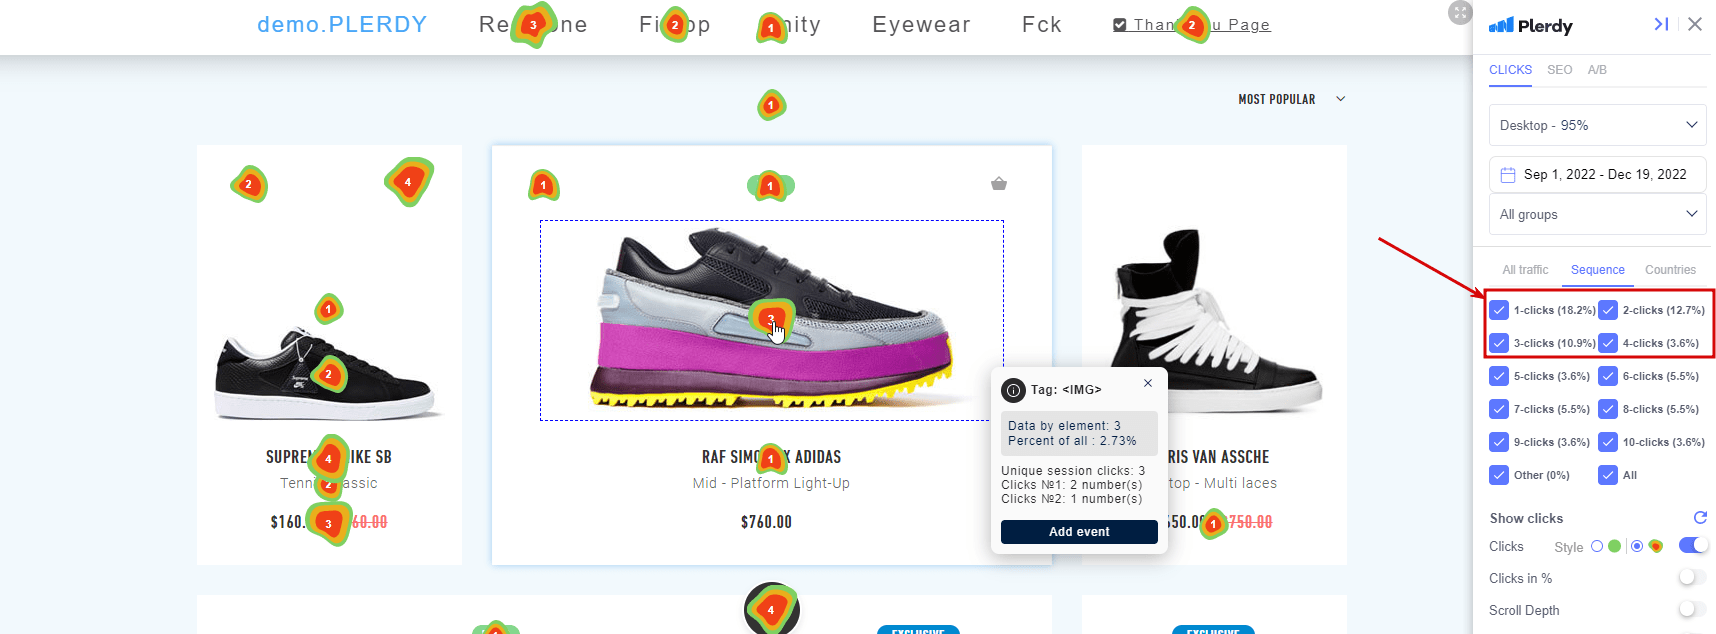
To view click sequences, open the Plerdy dashboard on your website -> Heatmaps -> Clicks -> Scroll down to the URL list to open a specific page. In the right menu, select the Click order tab -> Select 1-clicks.
13. Enhance UX with heatmap data
UX optimization is among the main uses of mouse heatmap software. Heatmap software clearly shows how guests feel on your pages and what obstacles they face. If they ignore a critical button, it signifies something is wrong. Conversely, when people act as expected, it means decent usability.
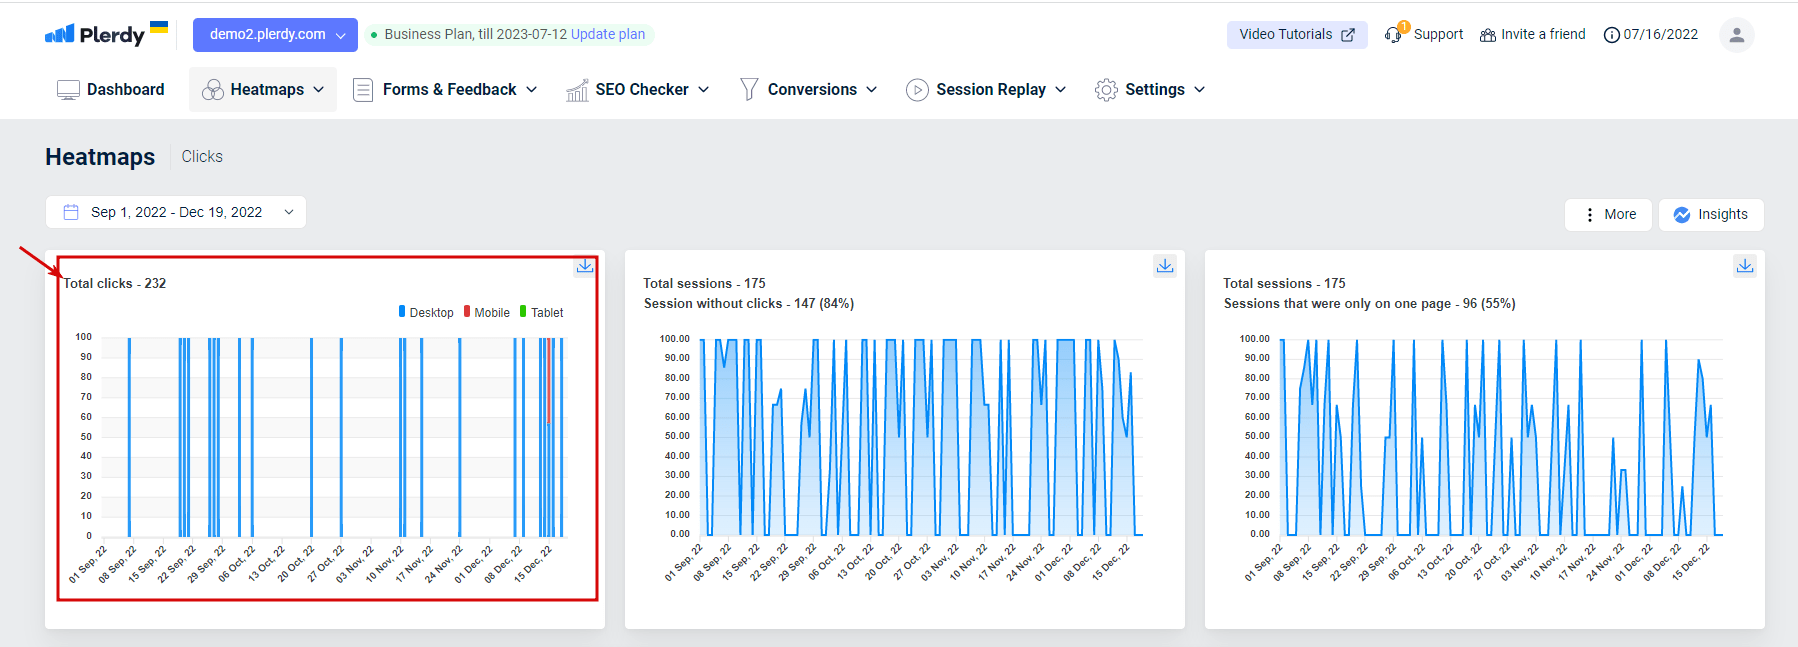
Heatmaps can provide you with the following data:
- Total clicks/sessions
- Sessions without clicks
- One-page sessions (bounce rates)
- Specific clicks on elements are displayed in real time.
During UX analysis, you have two tasks: to detect effective elements and things that get ignored or confuse people.
What Should Heatmap and Scroll Map Users Mind?
Heatmap and scroll map tools are mostly used by experienced specialists who analyze websites daily. Nevertheless, they will be equally helpful to website owners without usability, SEO, or web design expertise. The data format is clear and illustrative.
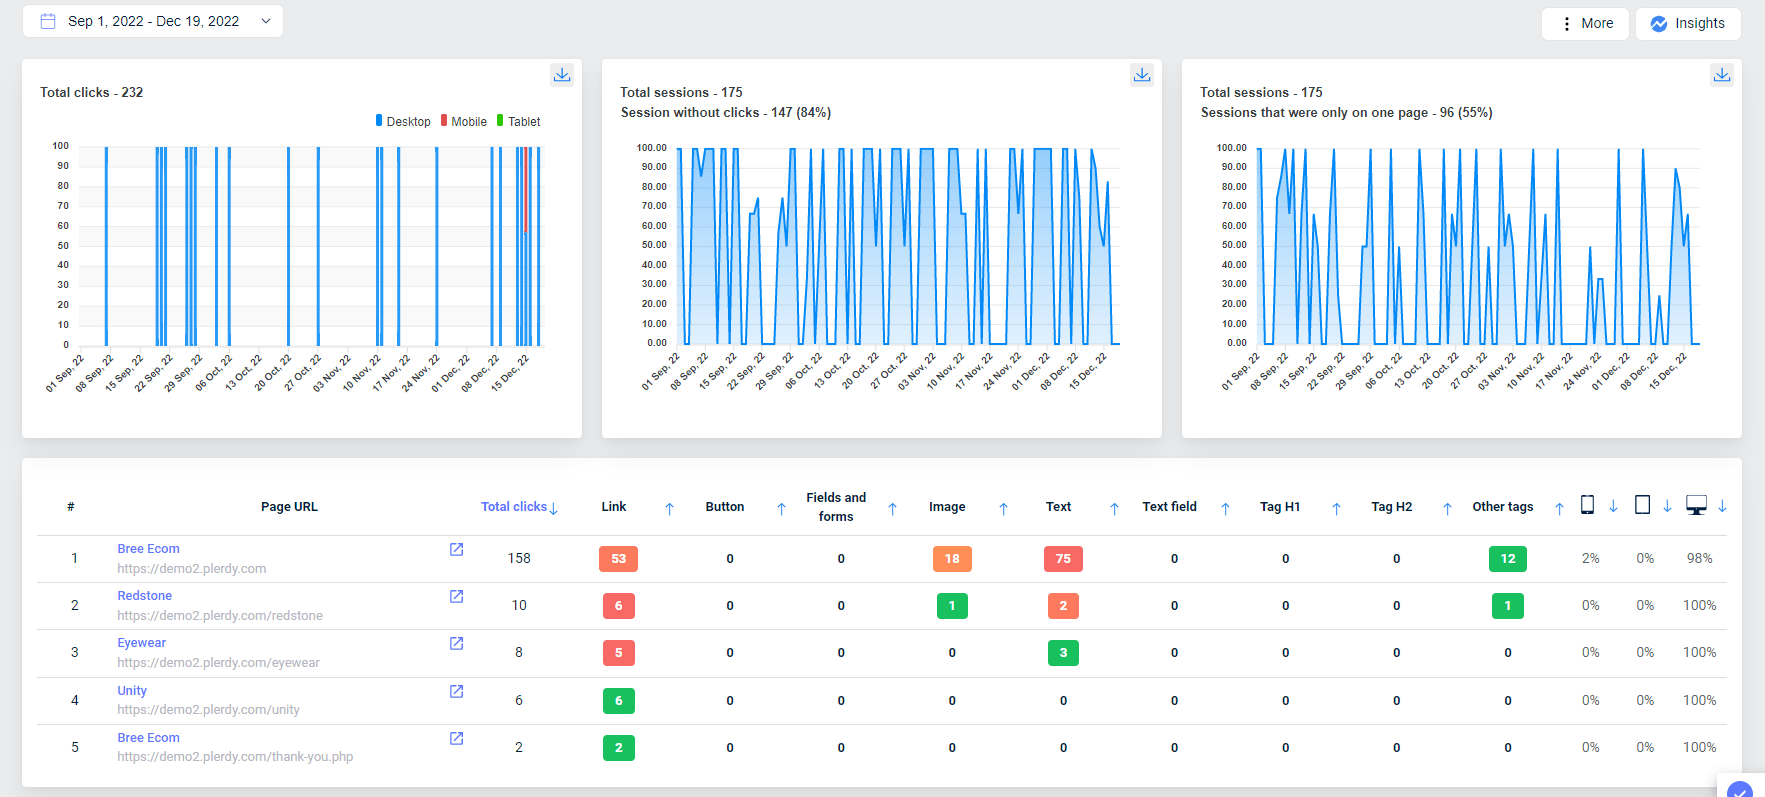
After accessing this information, you will have many ideas on what to improve. But before implementing any changes, check the following tips:
- Locate the most crucial information in the header (the name, navigation elements, contacts, etc.).
- Font size can highlight information like colors, fonts, and images.
- Remember about banner blindness. Since ads are everywhere, people stop noticing them.
- Many websites bombard visitors with offers, so the competition is fierce.
- Quality images sell better than words.
Also, every website update must be tested to see its impact on KPIs. It will secure you from making wrong design choices.
Conclusion about Heatmap Mouse Click Tracking
Mouse-click tracking heatmaps have proven to be handy in marketing analytics.
Real-time data on user behavior is more valuable than questionnaires or traditional analytics tools. Thanks to the mouse click heatmap, you can reduce abandoned carts, analyze unique offers or CTAs, and better understand the target audience.
Web design is another field that can benefit from mouse-click heatmaps. Web and UI/UX designers integrate them to test redesign solutions and plan changes.
Want to analyze websites with a mouse heatmap? Try it for free now.
