
Why Ecommerce Analytics Matter
Imagine running an online store but having no idea why visitors leave without buying. That’s like throwing a party and not knowing why half the guests leave before dessert. Ecommerce analytics helps solve this mystery by tracking customer behavior, showing you what works, and where potential buyers drop off.
A study by McKinsey found that companies using data-driven ecommerce strategies boost profitability by 6% more than competitors who rely on intuition. That’s the power of analytics! The real question is: Are you leveraging the right tools?
What is Ecommerce Analytics?
Ecommerce analytics is the process of collecting and analyzing data about website visitors, product interactions, and conversions. It helps answer questions like:
- Why do some products sell more than others?
- Which marketing channels bring the best ROI?
- Where do visitors drop off in the checkout process?
Understanding these patterns lets you optimize the customer journey and increase sales. But manually tracking everything? That’s a nightmare. You need the right tool.
How Plerdy Simplifies Ecommerce Analytics
Plerdy isn’t just another analytics tool—it’s your secret weapon for understanding customer behavior. Unlike traditional platforms that flood you with numbers, Plerdy visualizes data in a way that makes sense.
Here’s how it helps you get inside your customers’ heads:
1. Heatmaps: See What Catches Attention
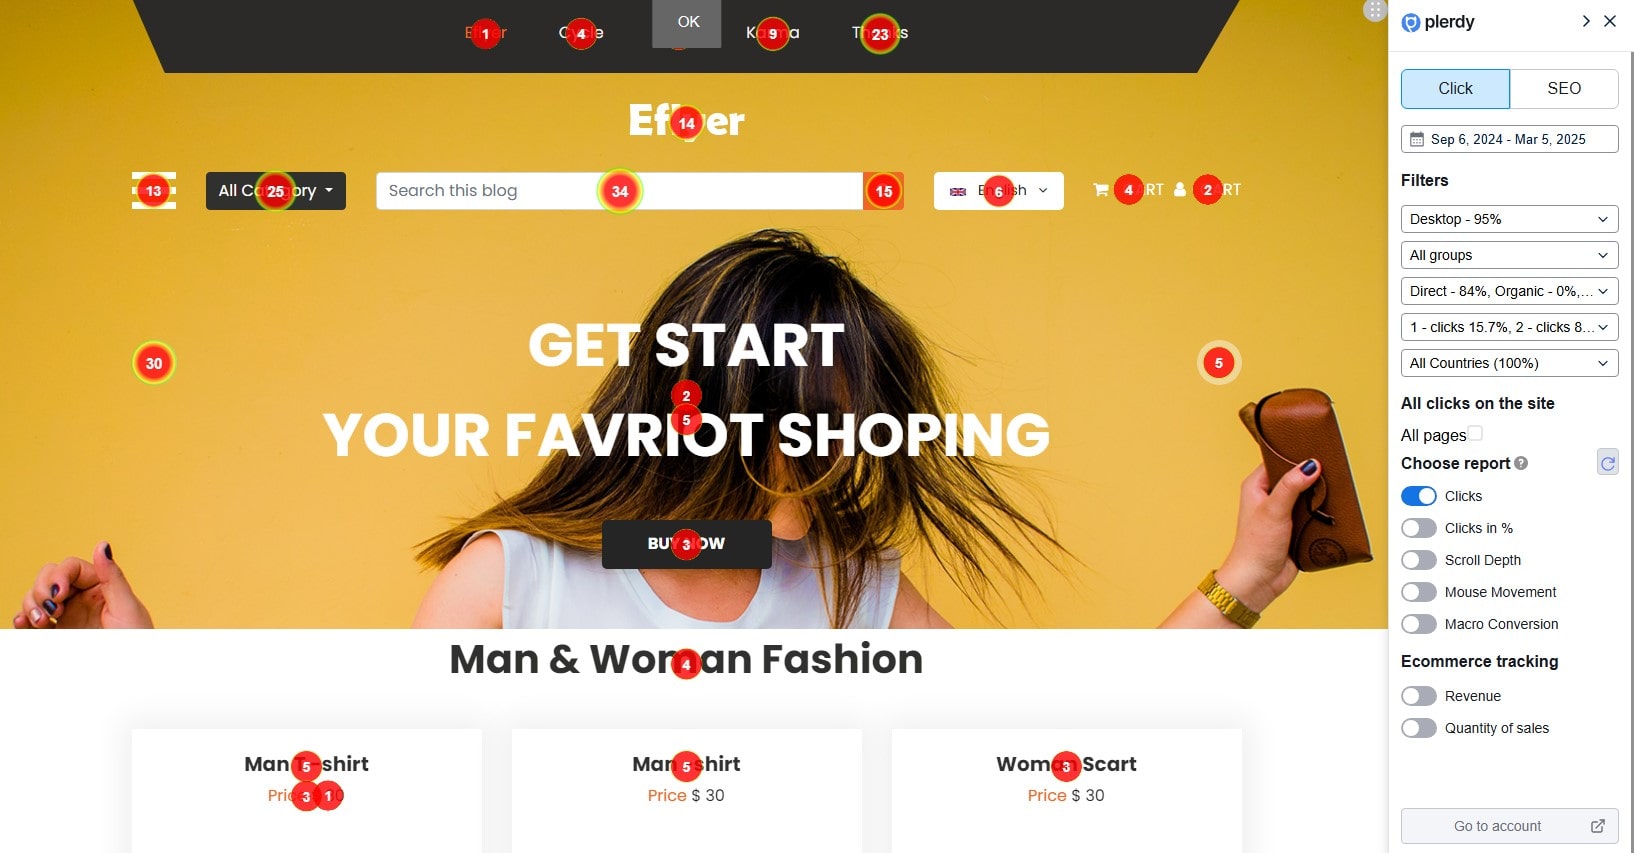
Ever wonder why visitors ignore your CTA button? Plerdy’s heatmaps show exactly where people click, scroll, and hover, helping you fine-tune your site for maximum engagement.
- Clicks Report – Displays the exact number of clicks on elements. Data appears within 1-2 seconds as you scroll.
- Clicks in % – Divides the page into five sections, ensuring clicks hidden in dynamic elements aren’t missed.
- Scroll Depth – Splits pages into ten equal parts, showing how deep users scroll before bouncing.
- Mouse Movement – Tracks where users hover their cursors, even if they don’t click or scroll.
- Macro Conversion – Reveals the last-clicked element before a purchase.
💡 Example: A fashion brand noticed customers spent more time on images than descriptions. They adjusted their layout, boosting product engagement by 30%!
2. Funnel Analysis: Fix Drop-Off Points
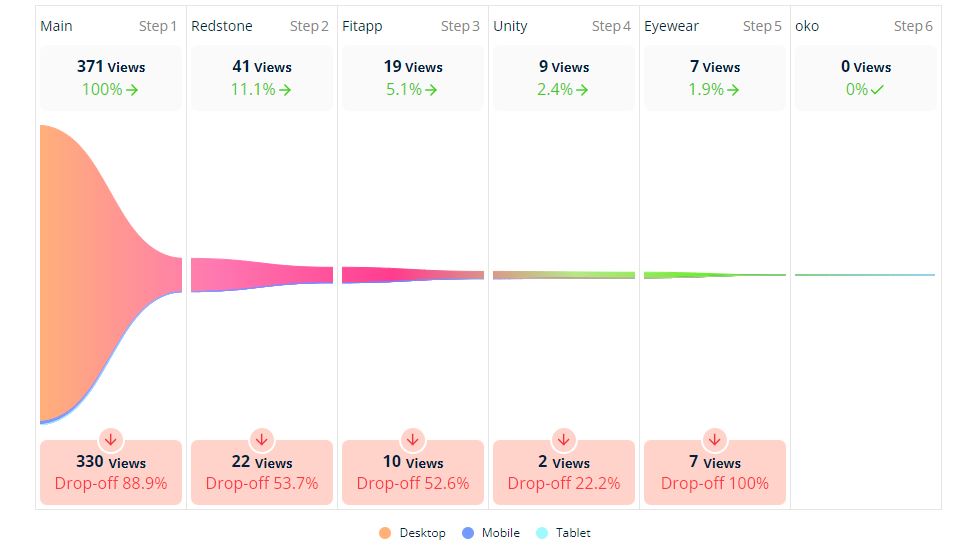
Create your first funnel:
- Select the first landing page – This is where users arrive from different traffic channels, such as a category page in an ecommerce store.
- Add the second step – This could be a product page that shares a common segment in the URL, like “product”.
- Set the final step – The “Thank You” page confirming the purchase.
Each step must be unique to ensure accurate tracking in Plerdy’s ecommerce analytics.
For deeper insights, leverage additional Plerdy tools:
- Traffic source filters – Identify which channels drive the most conversions.
- Micro-goals – Track clicks on key elements like “Add to Cart”.
- Session replays – Watch real user behavior to uncover UX bottlenecks.
- Heatmaps & scroll tracking – Analyze how far users scroll and where they click before dropping off.
A large online retailer noticed 35% of users dropped off at the delivery selection stage. Using Plerdy’s funnel analysis, they optimized the checkout process and increased completed purchases by 22%.
Advanced Funnel Insights with Plerdy
Ecommerce analytics is more than tracking clicks—it’s about optimizing every touchpoint. Plerdy allows segmentation by traffic source, device, and user behavior to refine each step in your conversion funnel.
- Break down user behavior by device – Mobile users often drop off at the payment step. Adjusting mobile UX can significantly boost conversions.
- Test different funnel paths – See whether users convert better through a category page → product → checkout flow, or from a homepage → product route.
- Identify high-exit pages – Find the weak links in your ecommerce funnel and optimize content, CTAs, and load times.
By using Plerdy’s ecommerce analytics, brands can eliminate guesswork and base decisions on real user data, leading to higher conversion rates and lower bounce rates.
3. Session Recordings: Watch Real User Behavior
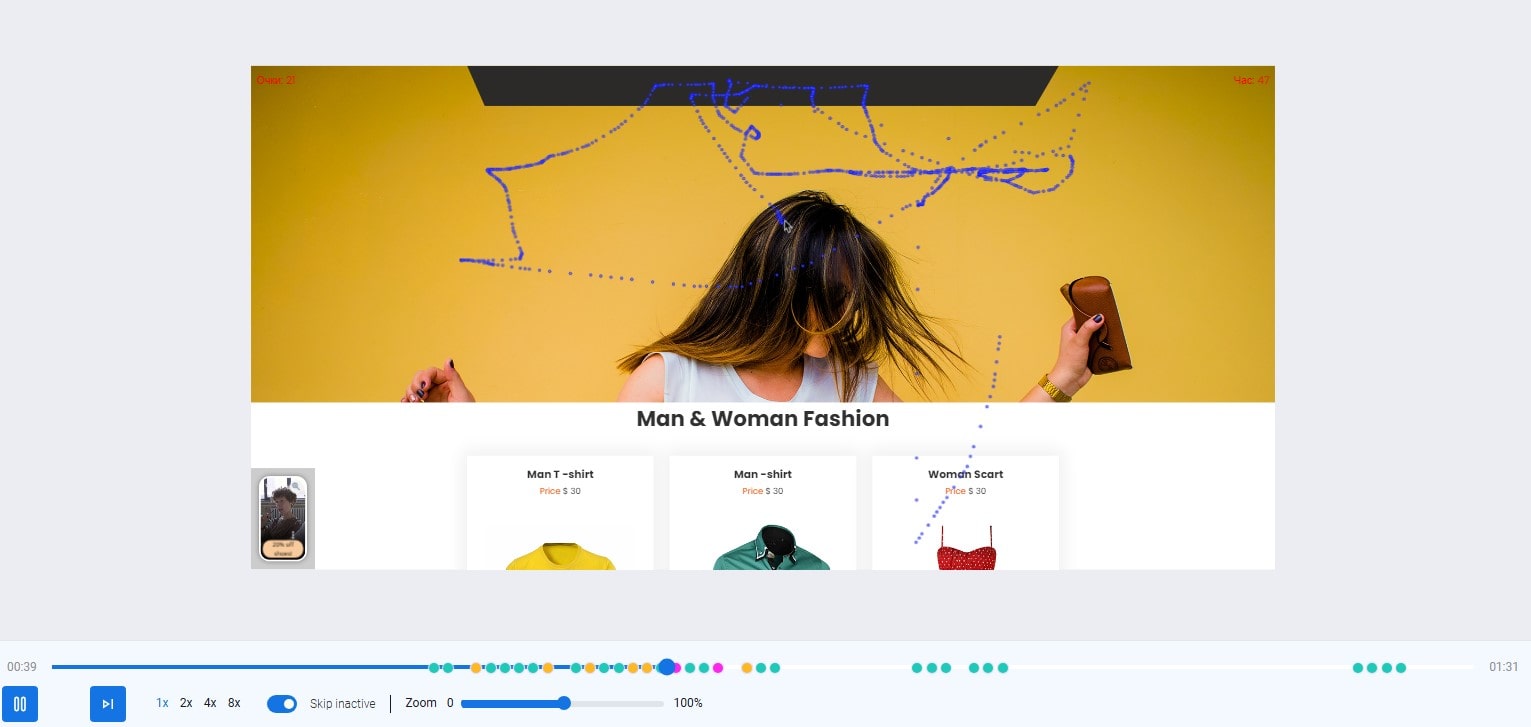
To start recording session replays in Plerdy’s ecommerce analytics, configure the recording rules in the settings. You can capture sessions from all website pages or select specific ones based on your analysis goals.
- Filter sessions by traffic source – See how users from paid ads behave differently than organic visitors.
- Enable auto-deletion – Keep only the most relevant session recordings to avoid data clutter.
- Track micro-goals – Identify users who click “Add to Cart” and analyze their journey.
- Use CRM integration – Match recorded sessions with user IDs for deeper customer insights.
A furniture store used Plerdy’s session replays to analyze user struggles with their checkout form. After adjusting the layout, their cart abandonment rate dropped by 15%, leading to higher conversions.
4. Pop-Up Forms: Convert More Visitors
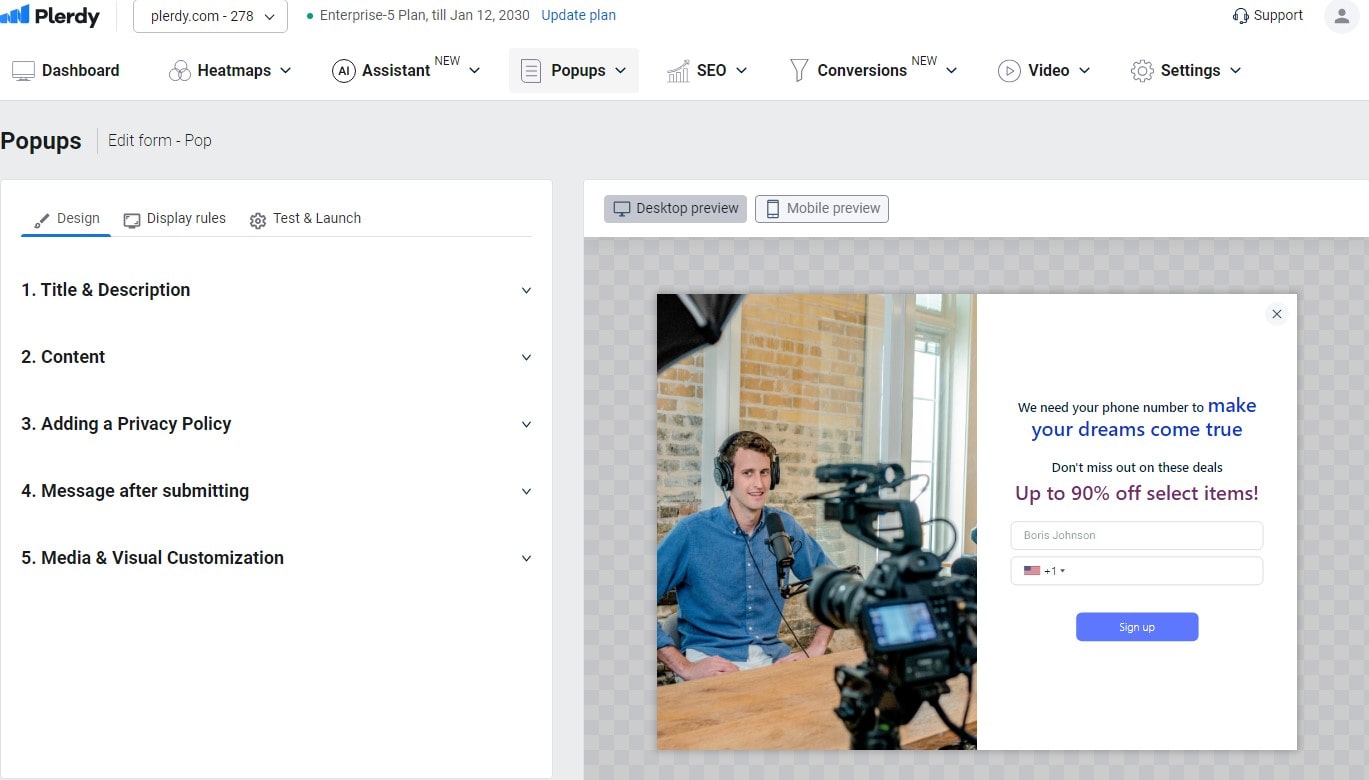
Pop-ups can either drive conversions or drive visitors away. With Plerdy’s ecommerce analytics, you can create strategic, well-timed pop-ups that engage users instead of annoying them.
- Lead Generation – Capture emails through enticing lead magnets and build your subscriber list.
- Promotional Offers – Highlight discounts, special deals, or limited-time sales.
- User Feedback – Collect insights on shopping experience, website navigation, and checkout process.
- Video Engagement – Display a short vertical video pop-up to introduce new products or events.
- Exit-Intent & Abandoned Cart – Prevent lost sales by reminding users about items left in their cart.
A beauty retailer used Plerdy’s pop-up forms to show a 10% discount after 20 seconds on-site. This resulted in a 22% increase in first-time purchases. With A/B testing, they further optimized the design and boosted engagement even more.
5. Event Tracking: Measure User Interactions in Real-Time
![]()
In Plerdy’s ecommerce analytics, event tracking helps monitor user actions, revealing what elements drive engagement and conversions.
- Set up micro-events – Track clicks on search bars, navigation menus, and buttons to see which elements users interact with most.
- Analyze repeated elements – Monitor common elements across pages, such as “Add to Cart” buttons, to understand behavior patterns.
- Segment interactions – Compare event performance by traffic source, device, or time of day for deeper insights.
A SaaS company used Plerdy’s event tracking to analyze CTA performance. After replacing “Learn More” with “Start Free Trial,” their sign-ups increased by 15%.
Comparison: Plerdy vs. Other Analytics Tools
| Feature | Plerdy | Google Analytics | Hotjar | Crazy Egg |
|---|---|---|---|---|
| Heatmaps | ✅ Yes | ❌ No | ✅ Yes | ✅ Yes |
| Funnel Analysis | ✅ Yes | ❌ No | ✅ Yes | ❌ No |
| Session Recordings | ✅ Yes | ❌ No | ✅ Yes | ✅ Yes |
| Pop-Up Forms | ✅ Yes | ❌ No | ❌ No | ❌ No |
| Real-Time Event Tracking | ✅ Yes | ✅ Yes | ❌ No | ❌ No |
Plerdy combines multiple tools in one, saving you money and eliminating the need for multiple subscriptions.
Pro Strategies for Using Ecommerce Analytics
1. Optimize Product Pages Based on User Behavior
Your product pages should feel like a personal shopping assistant, guiding users towards buying.
- Use Plerdy’s heatmaps to analyze clicks and scrolling behavior.
- Adjust images, descriptions, and buttons based on real customer data.
2. Improve Mobile Experience
More than 60% of ecommerce sales now happen on mobile. If your site isn’t optimized, you’re losing money.
- Use Plerdy’s analytics to see how mobile visitors behave.
- Adjust layouts, reduce page load time, and simplify checkout.
3. A/B Test Everything
Never assume—you need data to guide your decisions.
- Use Plerdy to test different versions of pop-ups, CTA buttons, and product placements.
- Optimize continuously—small tweaks lead to big revenue gains.
Final Thoughts: Time to Take Action
Ecommerce analytics isn’t a “nice-to-have.” It’s the difference between a struggling store and a thriving one.
Plerdy gives you the tools to understand what your customers do, why they do it, and how to make them buy more.
Stop guessing. Start optimizing. Try Plerdy today and watch your ecommerce business grow!
FAQ: Ecommerce Analytics: How to Understand Customer Behavior
What is ecommerce analytics, and why is it important?
Ecommerce analytics involves collecting and analyzing data about website visitors, product interactions, and conversion rates. It’s essential because it helps you understand why customers behave a certain way on your site—identifying strengths, weaknesses, and opportunities to improve the overall customer journey.
How does Plerdy simplify ecommerce analytics?
Plerdy streamlines the process by combining multiple tools into one platform. With features like heatmaps, funnel analysis, session recordings, pop-up forms, and real-time event tracking, Plerdy provides clear visual data that helps you optimize your site, reduce drop-offs, and ultimately boost sales.
How can funnel analysis help reduce customer drop-offs?
Funnel analysis lets you track each step of a customer’s journey—from landing on your site to completing a purchase. By identifying where visitors drop off (like during the delivery selection stage), you can fine-tune those steps. Plerdy’s funnel analysis offers segmentation by traffic source, device, and user behavior to help you pinpoint and fix these drop-off points.
What benefits does using Plerdy bring to an ecommerce business?
Using Plerdy not only eliminates the guesswork by providing data-driven insights, but it also offers an integrated approach to ecommerce analytics. This means you can:
- Visualize user interactions with heatmaps.
- Monitor real user behavior through session recordings.
- Optimize checkout processes using detailed funnel analysis.
- Convert more visitors with strategically-timed pop-up forms.
These combined features can lead to increased conversion rates, reduced bounce rates, and ultimately higher profitability.
How do I get started with Plerdy for my ecommerce site?
Begin by integrating Plerdy’s tools into your website. Set up heatmaps, define your conversion funnel, and enable session recordings to start collecting data. With Plerdy’s intuitive dashboard and real-time insights, you can quickly identify issues and test optimizations, making it easier to enhance customer behavior and boost sales in your ecommerce analytics strategy.