
Hey, did you know that the average SaaS business loses around 5-7% of its customers every month? Ouch. If you’re in the SaaS business, churn is probably your biggest headache—right after cold coffee and Wi-Fi crashes during Zoom calls. But what if I told you there’s a cool way to tackle churn using analytics? Yep, that’s right, today we’re diving into how Plerdy’s analytics tools help SaaS businesses fight churn like superheroes. No capes required!
Why Churn is the Arch-Nemesis of SaaS Businesses
Churn is when your customers wave goodbye, unsubscribe, and take their money elsewhere. For SaaS companies, this is a nightmare because you spend all your time (and cash) acquiring customers only to lose them quicker than you can say “bounce rate.”
But seriously, churn is bad news. It can tank your SaaS business faster than you can tweet “we’re working on it” during downtime. High churn rates make your business leaky—customers come in, and they spill out faster than your budget allows. According to some very serious reports, SaaS companies lose around 5-7% of their customers every month. Ouch!
That’s why analytics tools are a must-have for any SaaS business that wants to keep customers longer and happier. And here’s where Plerdy steps in, ready to save your business day.
How Plerdy’s Analytics Tools Actually Help You Reduce Churn
Now, let’s talk about how Plerdy analytics tools help SaaS businesses fight churn in real life. Grab a notebook, or just keep scrolling—I won’t judge.
Identify Pain Points with Heatmaps and Session Recordings
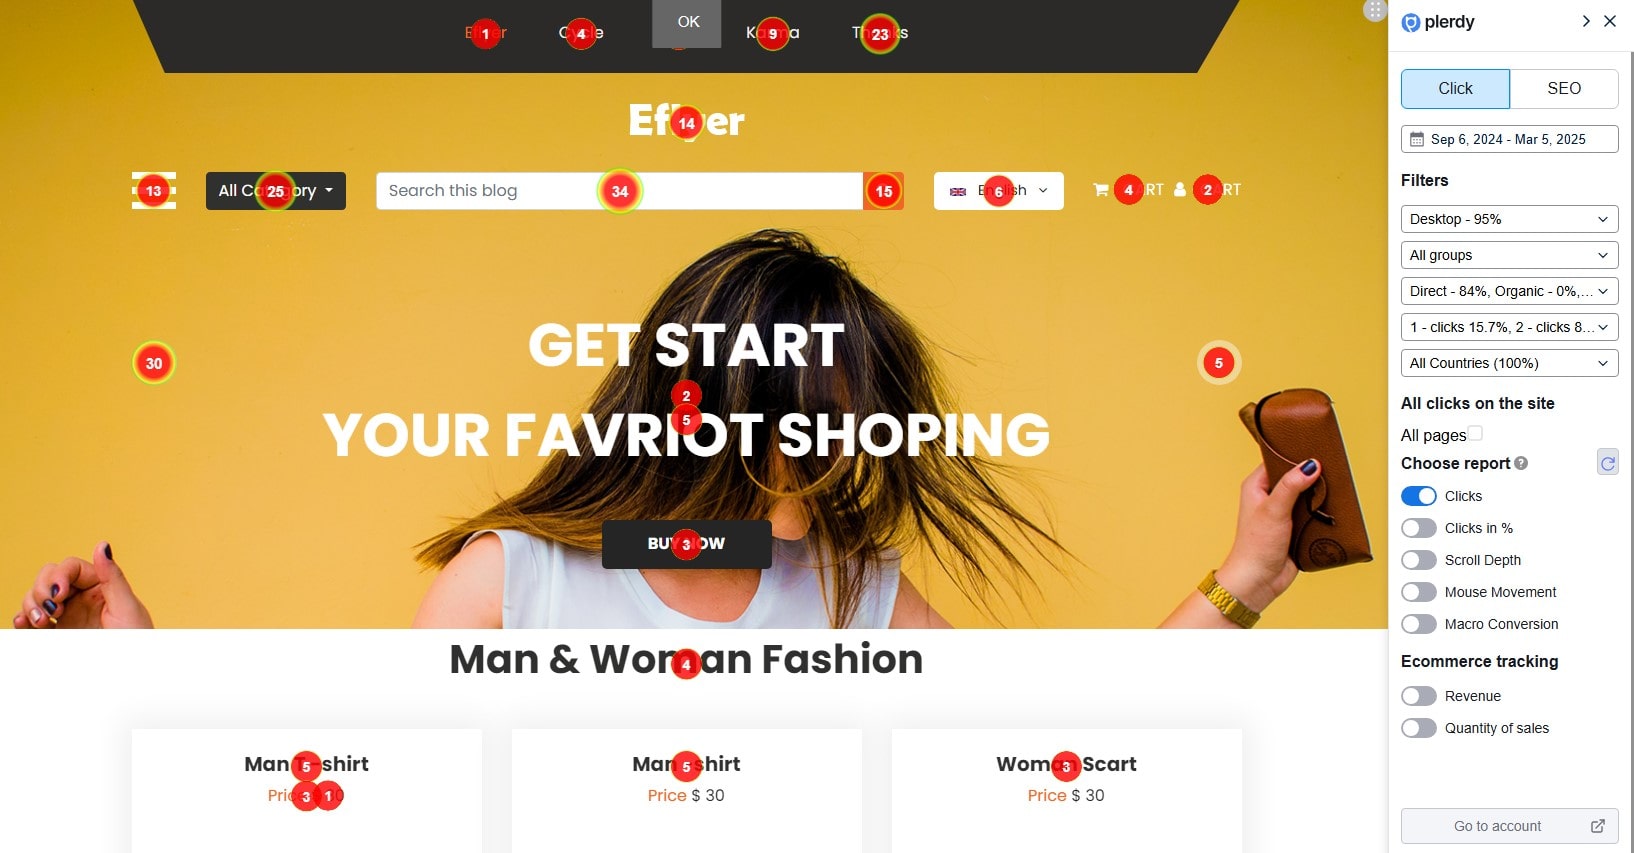
Sometimes, people quit your SaaS product because your signup form has more steps than a government office. Nobody loves confusing interfaces, especially if they’re paying you monthly. Plerdy’s heatmap analytics and session recordings show exactly where users get stuck. Imagine you run a CRM SaaS and notice through heatmaps that 60% of customers rage-click on a button that’s supposed to save their data. Not good, right? Plerdy points this out, you fix it, and boom—fewer frustrated customers, lower churn rate.
With session recordings, you can easily set specific rules for capturing user interactions. Want recordings from all pages or just specific ones? Easy. Need sessions from the US or Germany only? Also easy. Plerdy analytics lets you track micro-conversions too—like when someone clicks the “Add to Cart” button or fills out a lead form. And if you’re worried about privacy, Plerdy hides sensitive form data automatically (no drama with GDPR!). The analytics also let you tag and share video sessions with your business team, so you can collectively figure out why customers leave faster than Netflix cancels a good show.
Use Funnel Analytics to Spot Conversion Gaps
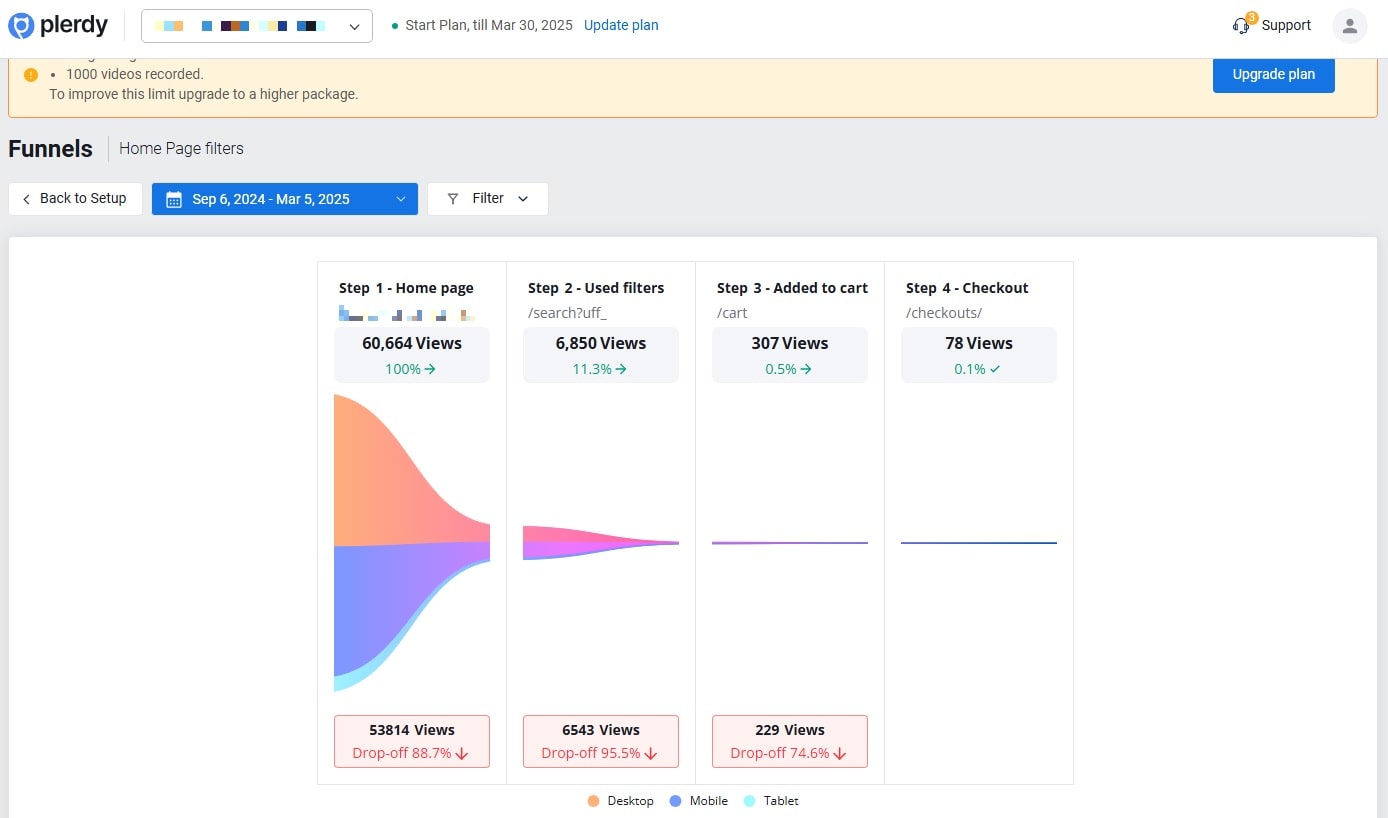
Next, let’s say you’re using Plerdy’s Website Funnel Analysis (no boring form analytics here!). It lets you track your user’s journey. For example:
- You notice 75% of your users sign up for your SaaS trial.
- Only 35% continue to step two.
- Just 12% end up subscribing.
Thanks to Plerdy analytics, you see clearly where your users get lost and leave your funnel crying. When you know where people drop off, you can patch up the funnel faster than fixing your Spotify playlist. This directly reduces churn because people stay engaged and see value quicker.
With Plerdy’s funnel analytics, building your first funnel is straightforward—pick your target pages (landing, product, and “Thank you”), ensuring each step is unique. This helps your SaaS business clearly identify bottlenecks. For instance, you might discover users abandon at the “Add to Cart” button due to slow load times or confusing navigation. Then, you use Plerdy’s heatmaps and video sessions to pinpoint these issues. By analyzing specific micro-events and segmenting user behavior by traffic channels, your SaaS business gains detailed insights that optimize conversion paths. Less friction, happier users—fewer drop-offs. Now, that’s analytics that actually helps your business.
Tailored Pop-ups for Customer Retention
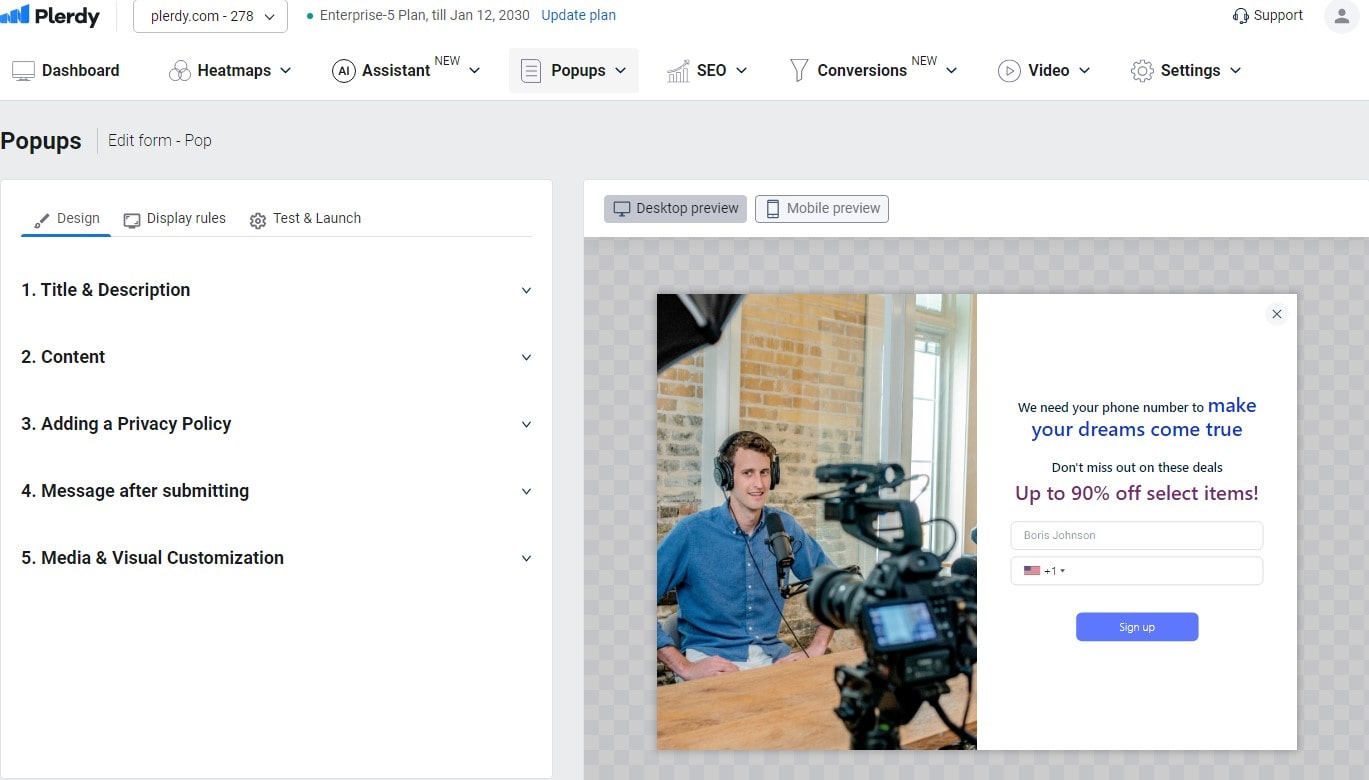
Imagine you’re the owner of SaaS business “TaskMaster” (yeah, let’s pretend that’s your company). You notice with Plerdy analytics that 32% of your customers leave your service page because they’re confused about features. What do you do?
- Show targeted pop-ups offering tutorials.
- Provide instant help links.
- Offer live chat support just before they exit (think of it as the digital version of “Wait! Don’t leave me!”).
These pop-ups help your SaaS users stick around long enough to see why your product is amazing. And yes, Plerdy can totally handle that.
Better UX = Happier Users = Lower Churn
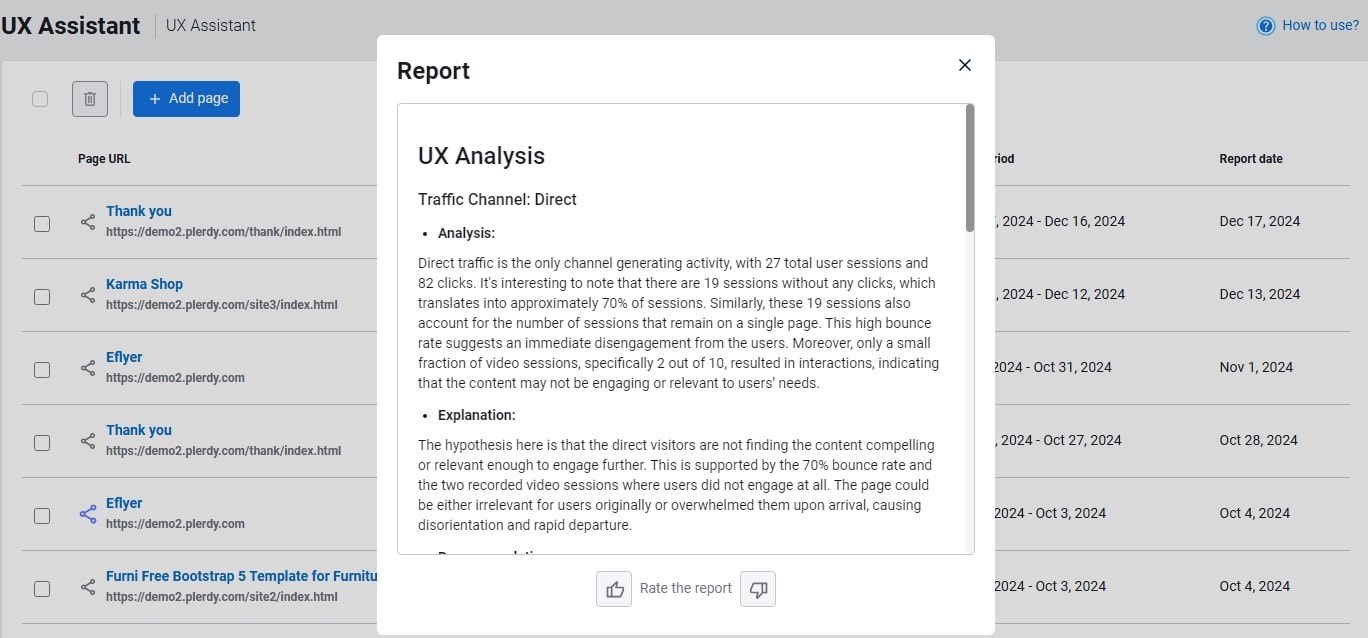
Analytics is the secret sauce behind the amazing UX of companies such as Slack and Trello. They know every click counts. Plerdy’s UX Assistant helps you do exactly the same for your SaaS product by highlighting which elements boost engagement and what irritates users. A study by Forrester (that’s real smart people) says improving UX can cut churn by up to 30%! So, if your SaaS users love clicking around your site or app, they’re gonna stick around, obviously.
But what if UX analytics feels tricky at first? Relax, Plerdy’s AI UX Assistant makes it simpler. You just pick the URL, select the device type, and generate a report—no coding skills needed. Plerdy analyzes user sessions, heatmaps, and funnel data, creating actionable UX recommendations specifically tailored to your business goals. Share these reports easily with your team or agency. Better UX analytics means happier users, fewer cancellations, and more growth for your SaaS business—no stress, just results.
Example of SaaS Companies Fighting Churn with Plerdy
Let’s see how some SaaS businesses win the churn battle with Plerdy:
| Company | Churn before Plerdy | Churn after using Plerdy | Improvement (%) |
|---|---|---|---|
| RankLogic | 12% monthly | 7% monthly | 40% reduction |
| TaskMaster | 18% monthly | 11% monthly | 44% improvement |
| SmartBudget | 18% monthly | 10% monthly | 44% improvement |
Not bad, right? Just imagine your SaaS name in that list. Cool? Cool.
Quick Tips to Crush Churn Rate with Plerdy
- Use heatmaps to spot UX annoyances (buttons nobody finds).
- Optimize your funnel steps—no more confusing paths!
- Check session recordings to see real user journeys (hello, Big Brother vibes, but friendly).
- Implement custom pop-ups to solve customer problems right away.
- Always track key metrics with funnel analytics to keep SaaS users engaged.
Wrapping Up & Next Steps
So, let’s sum up quickly: churn is the enemy, but Plerdy analytics tools are your new best friends. Heatmaps, funnel analysis, and smart pop-ups can help your SaaS business stop leaking customers. Remember, less churn means more growth, more profit, and less stress.
Ready to stop losing SaaS users faster than your patience on Monday mornings? Give Plerdy a spin and start seeing results for yourself. Trust me, your coffee tastes better when you’re not stressed about losing clients.
Go ahead—try Plerdy’s tools now and save your SaaS business from churn. Your analytics-powered success awaits!
FAQ: Why Every Digital Marketer Should Focus on Conversion Optimization
What is conversion optimization and why is it crucial for SaaS businesses?
Conversion optimization is the process of enhancing your website or app to boost the percentage of visitors who complete a desired action. For SaaS businesses, it’s vital because reducing customer churn and increasing trial-to-subscription rates directly impact your bottom line. Analytics plays a key role in identifying friction points and streamlining the user journey.
How do analytics help identify and solve conversion barriers?
Analytics tools, like those offered by Plerdy, provide insights through heatmaps, session recordings, and funnel analysis. They reveal where users drop off or get stuck, allowing you to quickly fix issues—such as confusing interfaces or broken paths—thereby optimizing the conversion process and enhancing overall UX.
What makes Plerdy’s analytics tools stand out for digital marketers?
Plerdy’s suite offers a comprehensive approach by combining heatmaps, session recordings, and funnel analytics. This integration gives you a clear view of user behavior, enabling rapid identification of problem areas and tailored solutions. It’s especially beneficial for SaaS businesses aiming to reduce churn and improve customer retention without complex setups.
How does funnel analytics contribute to conversion optimization?
Funnel analytics tracks the entire customer journey—from landing on a trial page to becoming a paying customer. By pinpointing where users drop off, you can optimize each step to reduce friction and improve conversion rates. This method is invaluable for any business looking to make data-driven decisions to boost performance.
Can targeted pop-ups and session recordings really impact customer retention?
Yes, targeted pop-ups can provide real-time assistance or offer tutorials to users at risk of leaving, while session recordings allow you to observe user behavior directly. These insights enable you to implement precise changes, ensuring that customers stay engaged and continue using your service—a strategy that is critical for reducing churn in SaaS businesses.