
Launching a startup is like jumping out of a plane and assembling the parachute on the way down. You don’t have time for guesswork—you need hard data. That’s where Plerdy steps in. It’s not just another analytics tool; it’s your startup’s secret weapon for making smart, data-driven decisions without drowning in spreadsheets or second-guessing yourself.
Why Data Matters for Startup Growth
Startups live or die by their decisions. Move too slowly, and you get outpaced. Make the wrong move, and you burn through cash faster than a Silicon Valley unicorn at a networking event. But what if you could base every decision on real user behavior rather than gut feelings?
- 90% of startups fail—often because they don’t understand their audience well enough.
- Companies that use data-driven strategies are 23 times more likely to acquire customers.
- Netflix saved $1 billion in 2017 just by using data to personalize recommendations.
Your startup might not be Netflix (yet), but Plerdy helps you harness data like a pro from day one.
Tracking User Behavior with Plerdy’s Heatmap
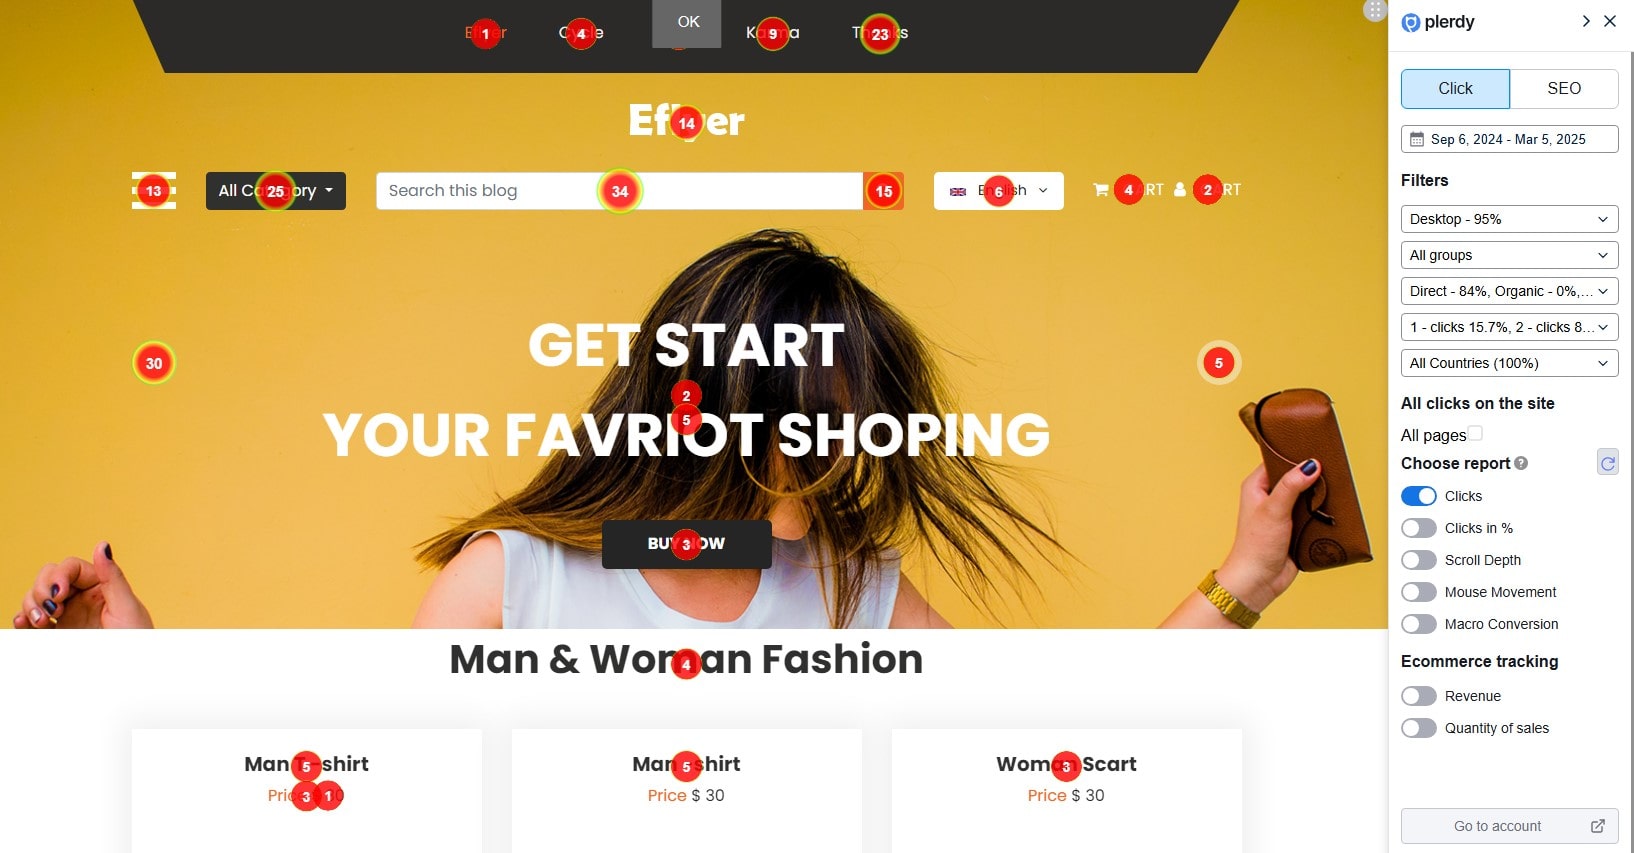
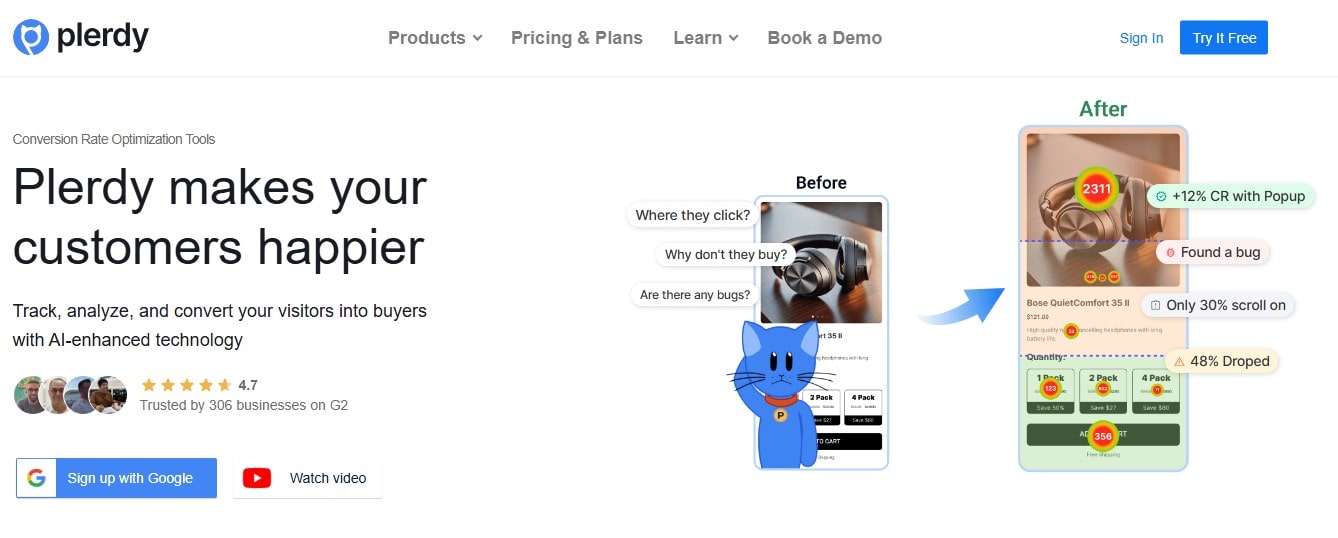
Ever wish you could read minds? Plerdy’s heatmap tool is the next best thing. It shows you exactly where visitors click, scroll, and ignore. Imagine knowing:
- ✅ Which CTA button gets the most action (and which one is a digital ghost town).
- ✅ How far users scroll before losing interest.
- ✅ What elements get ignored (because no one likes wasted space).
- ✅ Where users hesitate with their mouse movements before making a decision.
Plerdy’s Clicks report gives exact click counts on elements, updating dynamically as you scroll. If users hesitate before clicking, Staying a Mouse tracks their cursor movement, revealing hidden pain points. Clicks in % divides the page into five equal sections, ensuring no clicks go unnoticed—even on dynamic elements.
Want to know what users did right before purchasing? Macro Conversion reveals the last element clicked before checkout, helping startups refine their conversion paths. Meanwhile, Revenue Tracking assigns monetary values to clicks, showing which elements contribute directly to sales.
Example: A startup selling productivity apps noticed that users clicked a random image more than their actual “Buy Now” button. After adjusting the button placement, conversions jumped by 27% in a week. Another e-commerce startup discovered through Quantity of Sales tracking that 60% of sales originated from interactions above the fold—so they moved key products higher and boosted revenue by 35%.
Optimizing Conversion Rates Without the Guesswork
Startups don’t have time to A/B test every little thing manually. Plerdy automates CRO (conversion rate optimization) so you can make impactful changes without wasting weeks on trial and error.
How?
- Session Replay: Watch real users navigate your site—spot frustration points instantly.
- Funnel Analysis: See where potential customers drop off and fix those weak spots.
- Event Tracking: Find out what elements drive engagement (or get ignored).
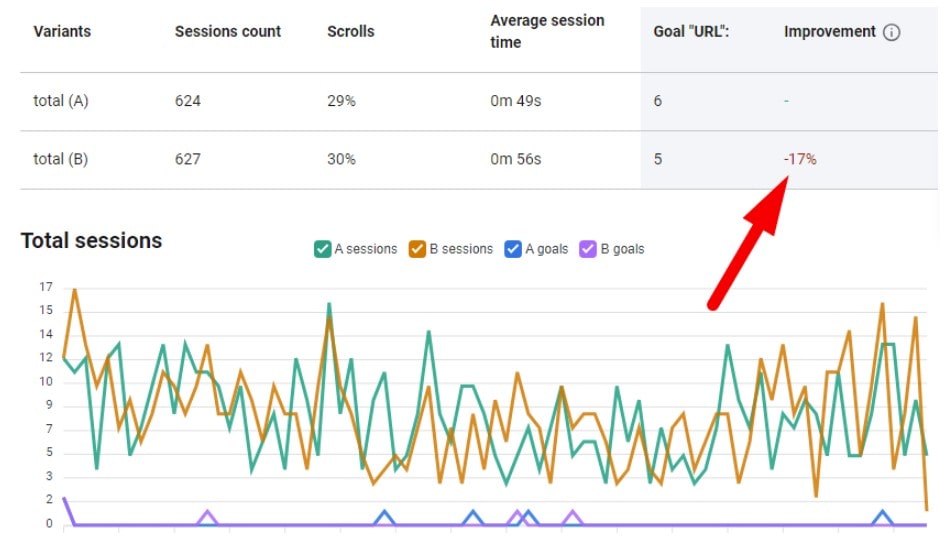
- A/B Testing: Compare different versions of your page, button colors, or layouts to find what converts better—without limits on traffic or views.
Plerdy’s A/B Testing Tool lets you run experiments effortlessly. Unlike other platforms that cap the number of visitors per test, Plerdy allows unlimited traffic, so even startups with low daily visits get reliable results. It’s as simple as selecting a test goal (clicks, sales, sign-ups), making a small change, and watching the real-time impact on conversions.
💡 Pro tip: A SaaS startup changed its CTA button color from blue to orange using Plerdy’s A/B Testing Tool. The result? A 19% boost in conversions within two weeks. Another company added a second CTA to their landing page and saw a 12% increase in sign-ups.
With real-time reports, Plerdy helps you stop guessing and start making data-driven decisions that maximize startup growth.
SEO Without Hiring an Expensive Expert
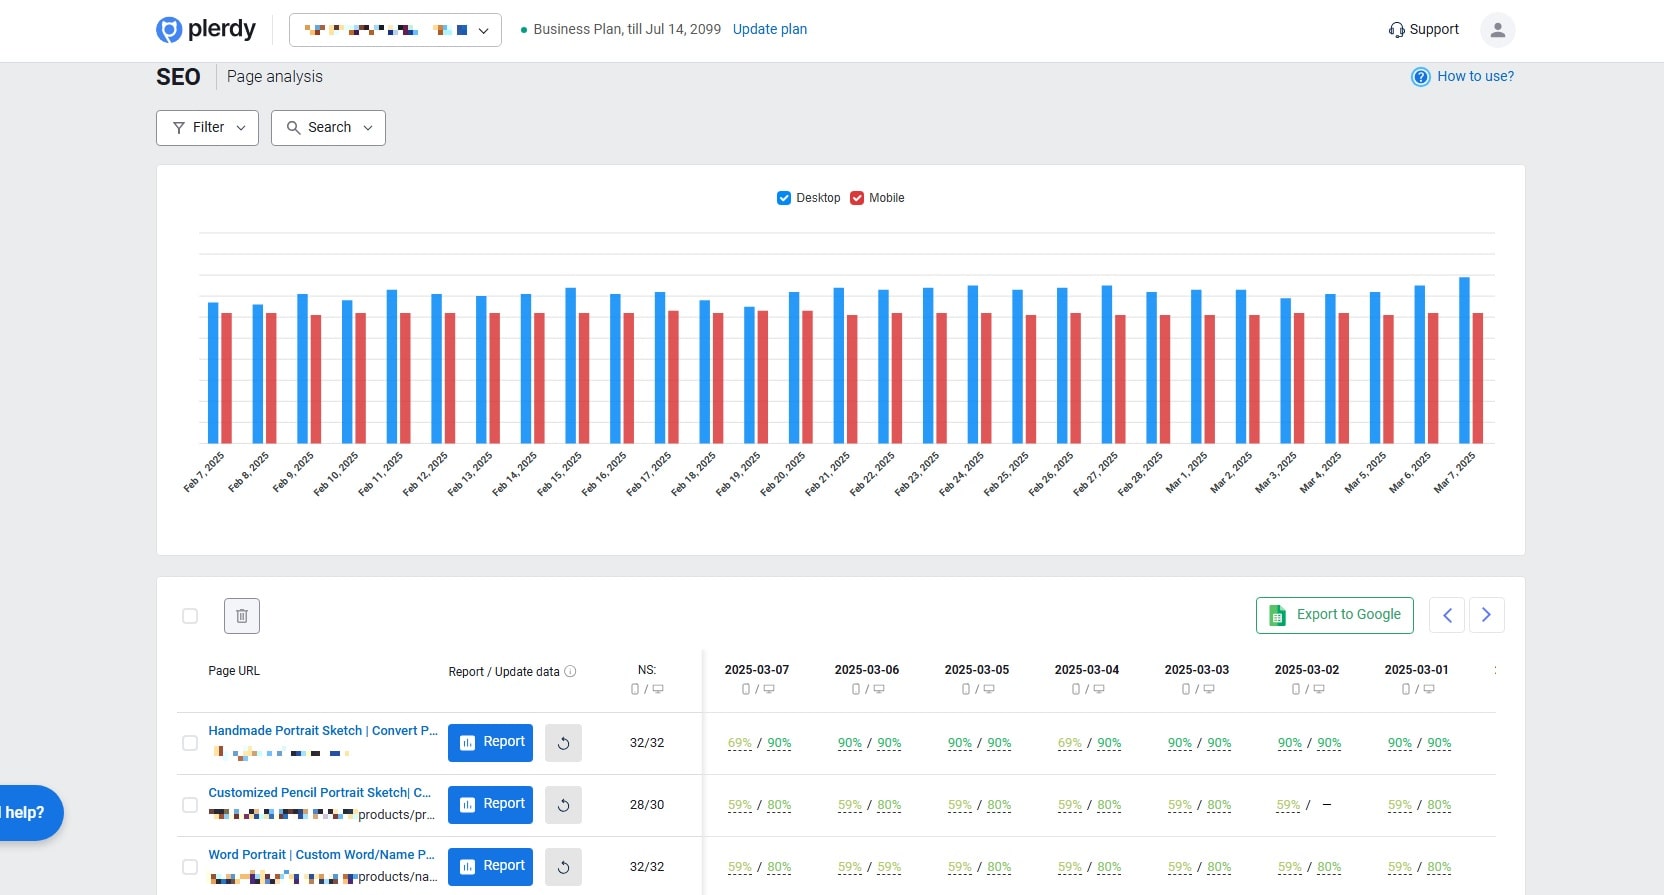
Let’s be real—SEO is a beast. If you’re a startup founder, you probably don’t have time to master every algorithm update. Luckily, Plerdy does the heavy lifting for you with its SEO Checker.
- ✔️ Find and fix broken links (because Google hates them).
- ✔️ Optimize meta titles/descriptions (because first impressions matter).
- ✔️ Track missing keywords and identify what Google Search Console suggests adding.
- ✔️ Analyze competitor strategies to see what’s working for them and how to improve your own rankings.
Plerdy’s automated SEO analysis collects data daily, flagging any changes that might impact rankings. Want to know which pages are losing traffic? Plerdy lets you track SEO anomalies in real time, so you can react before organic traffic tanks.
💡 Example: A small e-commerce startup struggled with organic traffic. After using Plerdy’s SEO checker, they fixed duplicate meta tags, added high-impact keywords, and optimized their site speed. Organic traffic increased by 47% in two months, and conversions improved by 15%.
Understanding Customer Feedback in Real-Time
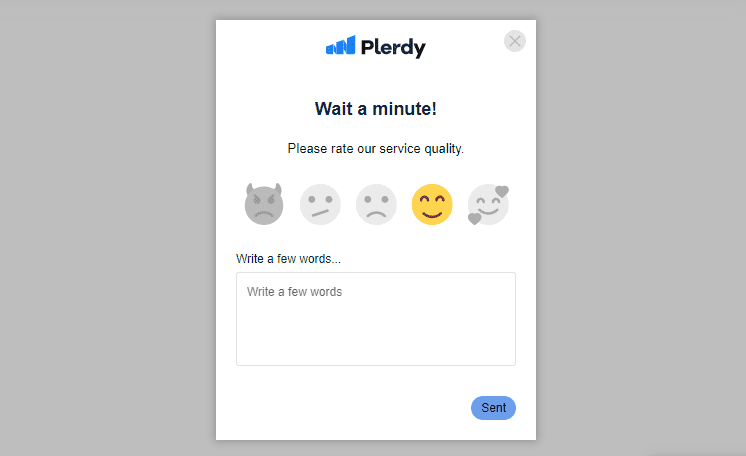
Ever wonder what’s going through a visitor’s head before they bounce? Plerdy’s website feedback tool lets you collect user insights without annoying pop-ups, helping startups make data-driven improvements that keep users engaged.
- Net Promoter Score (NPS) surveys reveal customer loyalty and identify brand advocates.
- Customer Effort Score (CES) measures how easily users complete key actions on your site.
- Customer Satisfaction (CSAT) provides real-time feedback on your services and user experience.
- Exit-intent pop-ups capture insights before users leave, helping you pinpoint friction points.
Plerdy’s advanced display rules ensure surveys appear at the right moment—after a purchase, when scrolling up, or before exiting. By segmenting users into detractors, neutrals, and promoters, startups can focus efforts on turning passive users into engaged customers.
💡 Example: A SaaS startup used Plerdy’s NPS survey to detect a rising number of detractors due to a confusing checkout process. After optimizing their flow, their churn rate dropped by 15%, and CSAT scores improved by 22%.
📊 Data point: Companies that act on customer feedback see a 10% increase in retention on average.
Table: How Plerdy Stacks Up Against Other Tools
| Feature | Plerdy | Google Analytics | Hotjar | Crazy Egg |
|---|---|---|---|---|
| Heatmaps | ✅ Yes | ❌ No | ✅ Yes | ✅ Yes |
| Session Replay | ✅ Yes | ❌ No | ✅ Yes | ✅ Yes |
| Funnel Analysis | ✅ Yes | ❌ No | ✅ Yes | ❌ No |
| SEO Checker | ✅ Yes | ❌ No | ❌ No | ❌ No |
| Feedback Collection | ✅ Yes | ❌ No | ✅ Yes | ❌ No |
Takeaway? Plerdy is the only tool that combines heatmaps, funnel tracking, and SEO in one dashboard—perfect for startup founders who need all-in-one insights without juggling multiple subscriptions.
Making Smarter Marketing Decisions with Plerdy
Data isn’t just for analytics nerds. Plerdy helps you fine-tune your marketing by showing what actually works.
1. Track Ad Performance
Why waste money on ads that don’t convert? Use event tracking to see which campaigns drive engagement.
2. Improve Landing Pages
A startup used Plerdy’s heatmaps and discovered their CTA button was too low on the page. Moving it higher increased clicks by 22%.
3. Refine Content Strategy
Find out which blog topics keep visitors hooked (and which ones flop).
Final Thoughts: Don’t Fly Blind—Use Plerdy
Running a startup is hard enough without making decisions based on gut feelings. Plerdy turns guesswork into strategy, helping you:
✔️ Understand user behavior (so you stop wasting time on bad design choices).
✔️ Optimize conversion rates (without hiring an expensive agency).
✔️ Improve SEO and content marketing (so you get found online).
Data-driven founders win more, fail less, and scale faster. Ready to make smarter decisions? Try Plerdy today and start optimizing like a pro!