It can be a real challenge to conveniently present a big scope of information that would allow readers to focus on really important things, keeping the connection between separate elements and the main idea. On the one hand, we have oceans of data that are constantly generated. On the other – a modern Internet user with weak concentration.
How do you get through this chaos to convey an important message to a target audience? There is a solution! Try to create an infographic.
Frequently asked questions from designers or content managers:
- Free infographic maker how to use?
- Which infographic maker is best for geometry?
What is an infographic? It’s a way to visually present information that is ideal to compile different data into a whole to make it more understandable to a final user.
It’s a visually appealing means of communication, which also has a viral effect. The experience of companies actively using infographics shows that these materials are more frequently shared in social media than other types of content. Judging by the Google Trends data, during recent years users’ interest to this format of information has dramatically increased:
And it’s not surprising, as an infographic is an effective way to unify a text, pictures, and elements of design into a whole to present some complex data in a logical form.
Advantages of Infographics: 3 Reasons to Use It!
Information has always been a powerful maker to attract people’s attention. Facts, figures, and expert analysis have a great power of persuasion. Allow the audience to learn and see what interests them, and you will get a chance to influence beliefs and decisions.
Here are three reasons why you should consider infographics as a maker for business promotion.
- Comprehensibility. People tend to perceive information visually. They love figures, facts, and statistics. Whereas a well-thought-out combination of text, pictures, and other visual elements allows focusing people’s attention on the most important things.
- Effectiveness. Probably, each of you will agree with the statement that modern Internet users rarely read all content of pages. Visitors of a page try to get the most information for the shortest period possible. The structuring of data as a simple infographic is a great way to pack the maximum amount of useful information in a compact form allowing the audience to review it quickly.
- Brand Awareness. Creating infographics with the elements of a company’s corporate identity, such as a logo, a website address, and a brand name, is a powerful maker to improve brand awareness. If you are a newbie in the market, creating and spreading high-quality infographics save a considerable portion of the marketing budget.
If the result of work is useful and attractive enough, people will be interested in sharing such content with friends.
Best Infographic Makers
Appealing, clear, and useful…an infographic inevitably has a lot of advantages. There may be only one obstacle on the way to using it. Namely, if Adobe Photoshop skills are insufficient, it will be impossible to create something beautiful and do this during a reasonable period.
Fortunately, this was a global problem. Therefore, developers quite quickly created different infographic makers that solved it. In this article, we have decided to select the best infographic software, that judging by users’ feedback, is good at its task.
Easel.ly
One of the most famous infographic makers. After the registration, users get a blank canvas and access to a large library of objects they can combine to get the desired result. Choose from 15 ready-made templates and apply any of them, just dragging them to the canvas.
Piktochart.com
A software for infographics and presentation materials that allows to present even a boring content in an appealing way just in a few clicks. You can choose from 7 templates if you want a free infographic or switch to a paid account ($29) and enjoy 120 themes.
A customizable infographic maker allows to change color schemes and fonts, utilize a library of objects, and upload additional images. Start working from a blank canvas, create and save your theme.
Infogr.am
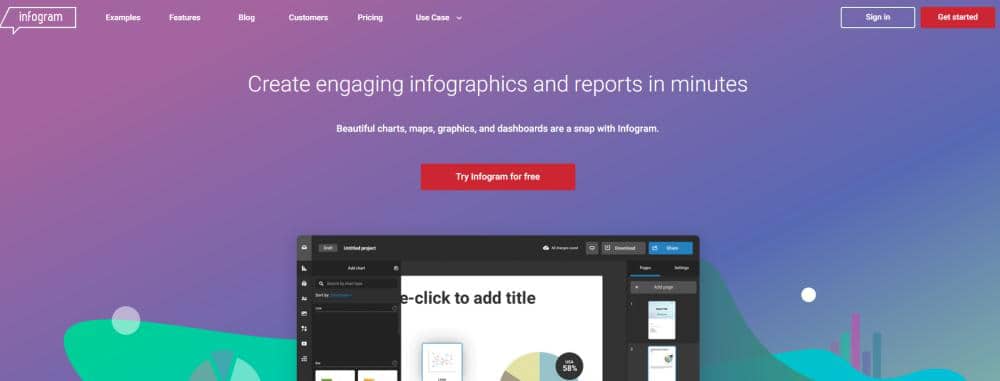
This service is mainly used to create diagrams, but it also has enough makers to work with infographics. It’s worth noting that here you will find over 30 types of diagrams and can save the results of work in a PNG or PDF format (for paid accounts).
Visual.ly
This is a service for those who need advanced makers for professional use. It’s more complicated compared to its analogs but has better functionality.
Canva.com
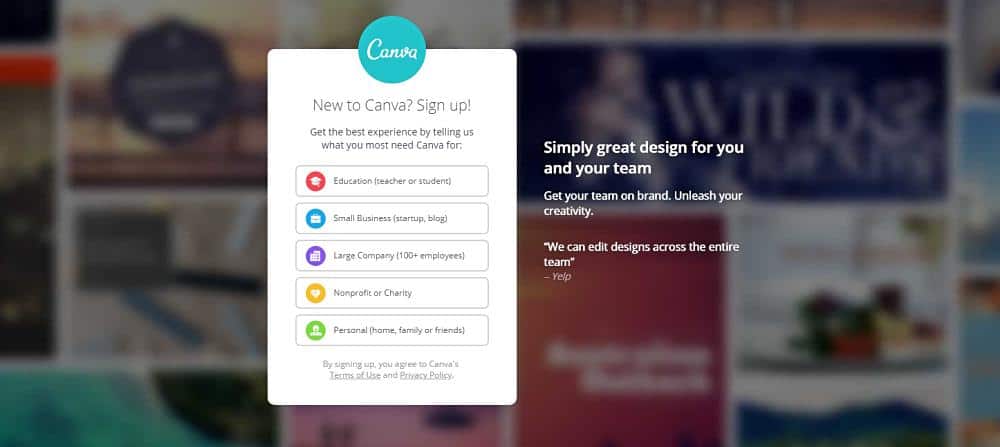
Having appeared just two years ago, this Australian start-up has become a real change in the world of web design. Create beautiful graphics for social networks, sites, postcards, etc.
An infographic is a great maker that can be used for marketing purposes. Unfortunately, if ordered from a third party, it can be pretty costly. So if you have a limited budget, take note of these services that will allow you to create a DIY infographic.
6 Tips on How to Create Infographics
Such data presentation makers as infographics can be appealing and useful, but only if properly done.
Decide upon goals. The first thing you should do before you start the work is setting goals you will achieve. For example, spread the word about the brand, educate customers, or provide entertainment information to keep the existing audience and increase its loyalty.
Focus on niche. Don’t waste time creating an infographic design that isn’t directly related to the subject of business. Get an appealing result, but most probably audience won’t be interested in it.
Look for problems and controversial topics. How-to articles are perfectly suitable as a basis for an infographic. This way, you create a short tutorial on solving a certain problem that will be useful to readers. Controversial topics produce equally great results. Being actively shared in social networks, they can attract a lot of traffic to a website.
Highlight the key points. After the data is processed, filtered, and its logical structure is defined, choose the most interesting facts and highlight them in a way so that readers immediately notice them.
Simplify sharing. Some people who will like the result of work will want to share it on social networks. The others may wish to send a link to their friends and colleagues. You must ensure that in both cases, they can easily do that. Add the “Copy the link” button, and after a user clicks it, the link to a document will be immediately copied to a clipboard.
Be inspired by the best. No one can produce a perfect result from the start. But if you find some inspiring examples and try to reach the level of professional designers’ works, gradually develop the style that will distinguish you from others.
Conclusions
Infographics can be efficiently utilized as digital marketing makers. And you have to use this opportunity.
