Running a website without tracking key metrics is like throwing darts in the dark—you’re just hoping something sticks. Every business that wants to grow needs to track essential website metrics to understand how users interact with their pages, where traffic comes from, and what’s stopping conversions.
Without the right business metrics, you’re guessing. And guessing doesn’t lead to business growth. That’s where Plerdy comes in. With the right Plerdy tools, you can measure and improve everything that impacts your website performance, from conversion rates to user behavior. Let’s break down the most important metrics that every business website should track—and how Plerdy helps optimize them.
1. Conversion Rate – The Core Metric for Business Growth
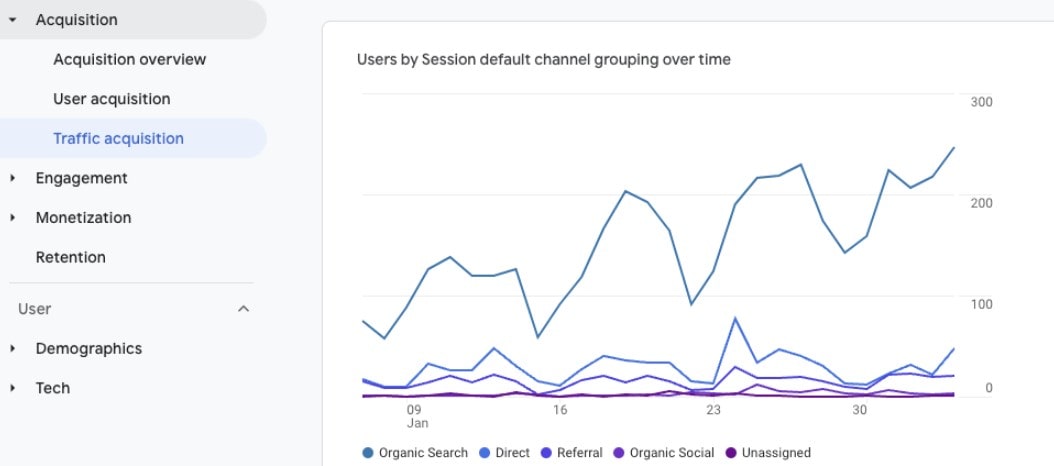
If your website isn’t converting, your business isn’t growing. Conversion rate is one of the most critical metrics that determines how many visitors take a desired action—whether that’s making a purchase, signing up for a newsletter, or filling out a contact form.
Why This Metric Matters for Your Website Business
- If your conversion rate is below 2%, your website is underperforming.
- Well-optimized business websites often reach 5-10% conversion rates, leading to significantly higher revenue.
- Even a 1% increase in conversion rate can result in thousands of extra dollars in revenue for an eCommerce or SaaS business.
How Plerdy Helps Optimize This Website Metric
Tracking website metrics is the foundation of every business that wants to boost conversions and understand user behavior. If you don’t measure, you can’t improve. That’s where Plerdy comes in—turning raw data into actionable insights for your business website.
- Plerdy’s Website Funnel Analysis helps identify where users drop off in your conversion funnel. This is crucial for eCommerce and SaaS businesses, where a small change can mean thousands of dollars in extra revenue.
- Plerdy Heatmaps visualize how users interact with your website, showing which elements attract attention and which are ignored. A misplaced CTA could be the difference between a bounce and a sale.
- Plerdy Session Replays let you watch real user interactions, revealing what frustrates or confuses visitors. If users keep abandoning their carts, a replay might show they struggle with a slow-loading payment page.
- Macro Conversion Tracking pinpoints the exact elements users engage with before completing a purchase, helping your business optimize high-value pages.
- Plerdy Click Maps highlight the most clicked elements, ensuring your website design aligns with user behavior, not assumptions.
With Plerdy, your business doesn’t have to rely on gut feelings. Instead, you get hard data to fix website issues, optimize your website metrics, and turn more visitors into paying customers.
2. Bounce Rate – The Website Metric You Can’t Ignore
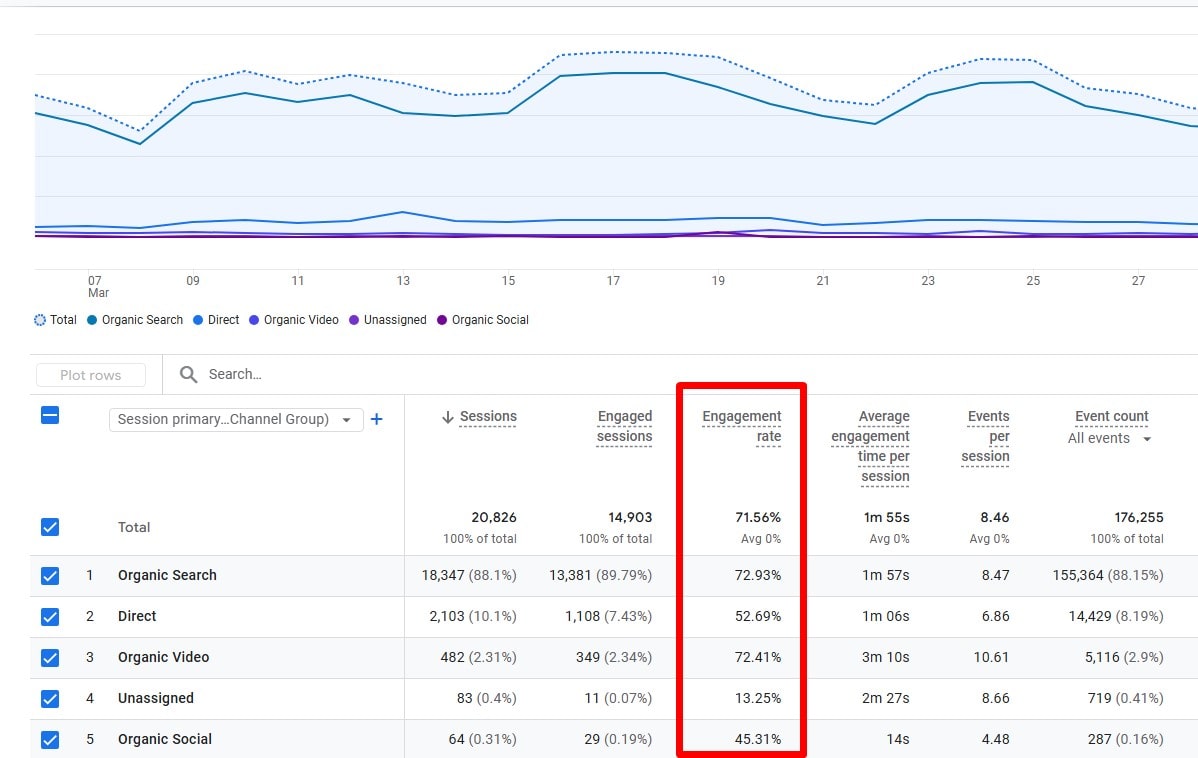
A high bounce rate means visitors land on your website and leave without interacting. If they’re not clicking, scrolling, or engaging, your business is losing potential customers.
Industry Standards for Bounce Rate Metrics
- Under 40% – Great! Your website keeps visitors engaged.
- 40-60% – Average. Your business website has room for improvement.
- Over 70% – 🚨 Warning! Your website is failing to hold attention.
How Plerdy Reduces Your Website’s Bounce Rate
A high bounce rate means your website is losing potential customers before they even engage. If visitors land on your business website and leave within seconds, something isn’t working—maybe it’s slow loading, unclear messaging, or weak CTAs. That’s why Plerdy’s tools are designed to help reduce bounce rates and keep users engaged.
- Plerdy Heatmaps show which sections of your website get the least engagement. If users ignore key elements, you can adjust their placement to optimize interaction.
- Session Replays let you see how users move through your business website before they leave. Understanding user frustration points helps improve retention.
- Plerdy Pop-ups & Forms engage users with strategic messages before they exit, increasing conversion opportunities.
- Plerdy Scroll Depth Tracking reveals how far visitors scroll, helping businesses ensure critical content appears before users lose interest.
- Clicks in % Reports divide the page into sections to highlight interaction hotspots, preventing missed engagement areas.
A better bounce rate metric means visitors spend more time on your business website, increasing the likelihood of conversions and improved performance.
3. Traffic Sources – Where Your Business Website Visitors Come From
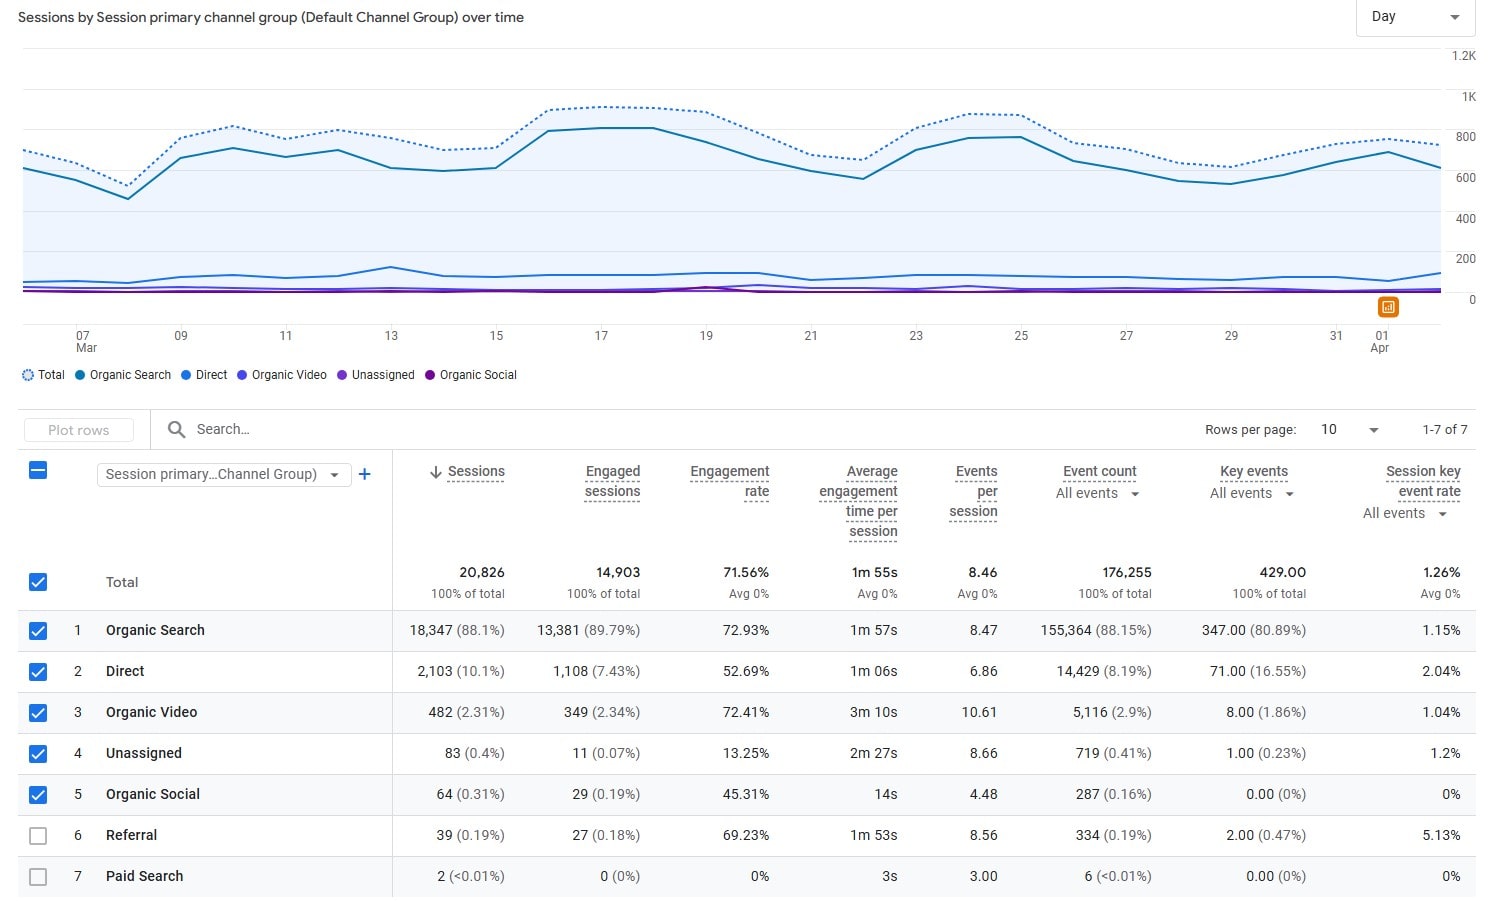
Not all website traffic is created equal. Some visitors come ready to buy, while others just browse. Tracking your business website’s traffic sources helps you understand where your best leads come from.
Average Traffic Metrics Across Websites
| Traffic Source | Average Share (%) |
|---|---|
| Organic Search | 53% |
| Paid Ads | 15% |
| Social Media | 12% |
| Direct Traffic | 10% |
| Referral | 10% |
How Plerdy Helps Track and Optimize This Website Metric
Tracking SEO metrics is essential for improving your business website’s visibility and ranking in search results. Without proper website SEO tracking, you risk losing organic traffic and missing out on valuable conversion opportunities. Plerdy’s SEO tools simplify this process by providing automated insights and practical recommendations.
- Plerdy’s SEO Checker automatically audits your website, identifying technical issues like broken links, duplicate content, and slow-loading pages. This ensures your business stays competitive in search rankings.
- Keyword Gap Analysis helps find missing keywords, allowing you to optimize content based on Google Search Console data and attract more organic traffic.
- Plerdy Competitor Analysis shows how your business website compares to rivals, highlighting content structures and keywords that drive success.
- Plerdy’s SEO History Tracking keeps records of key changes, making it easy to monitor trends and react before rankings drop.
- SEO Tagging & Filtering lets marketers segment keywords and pages for detailed performance tracking, saving time on daily audits.
By integrating Plerdy SEO tools, businesses can make data-driven decisions, improve search visibility, and enhance their overall website performance.
4. User Behavior – What’s Happening on Your Website?
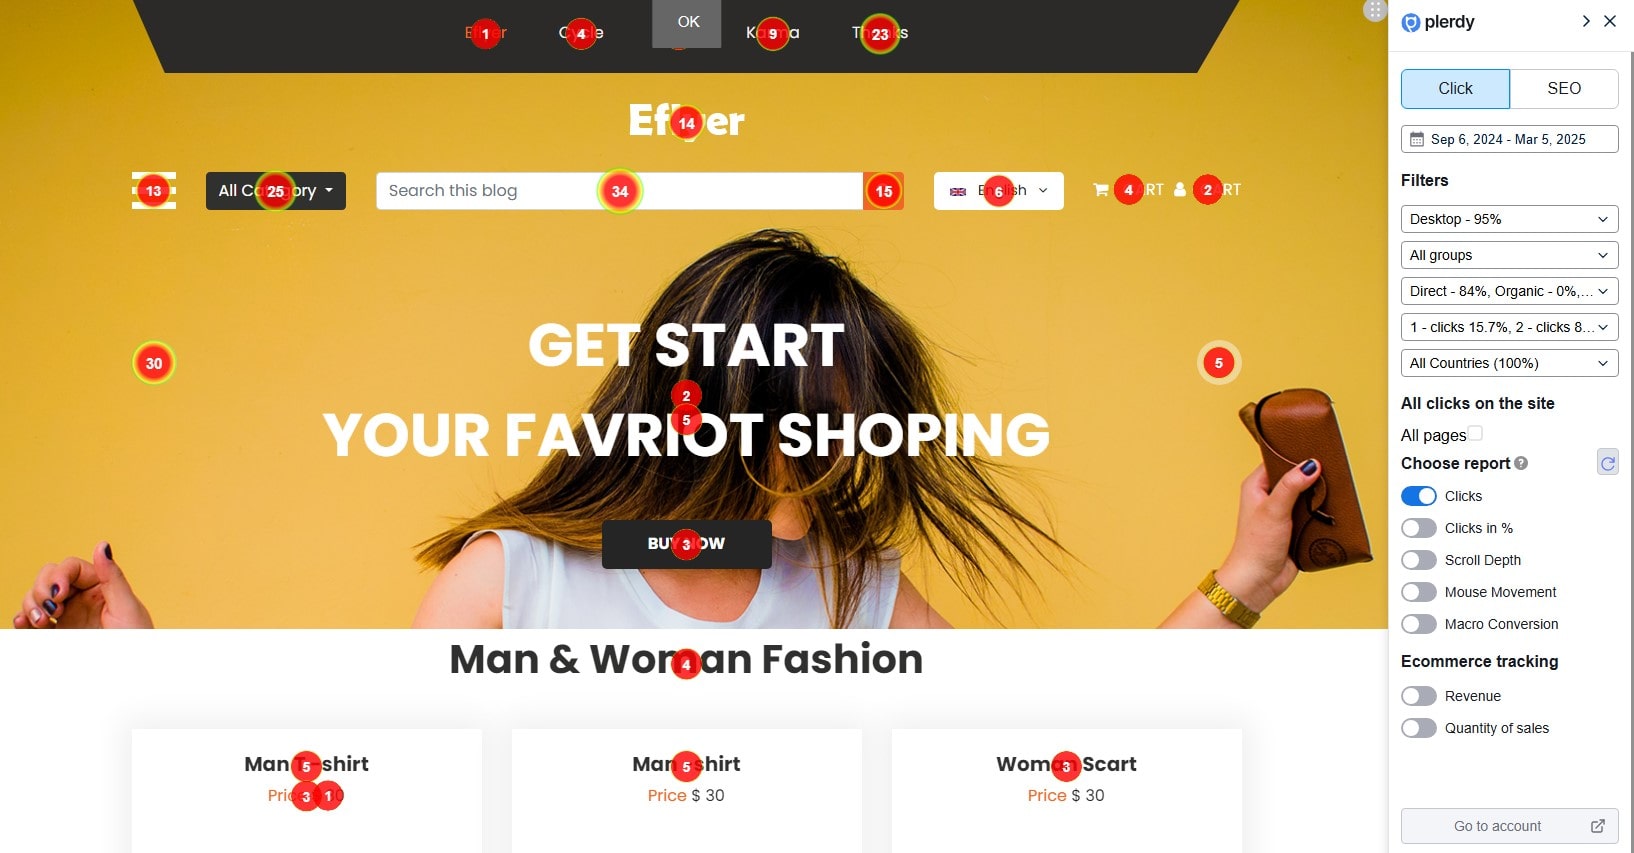
If you’re only tracking page views, you’re missing out on crucial business website metrics. What matters is how visitors interact with your website. Are they clicking your CTAs? Are they scrolling past important content?
Plerdy’s Advanced User Behavior Metrics & Tools
Understanding website metrics is crucial for optimizing your business website and increasing conversions. Plerdy’s heatmap and click tracking tools provide valuable insights into user behavior, allowing businesses to refine their pages for maximum engagement.
- Clicks Report in Plerdy shows detailed click data for every element on your website, helping businesses identify high- and low-performing areas.
- Clicks in % Report divides the page into five equal sections, revealing hidden click patterns that may be lost in dynamic elements.
- Scroll Depth Analysis tracks how far users scroll, ensuring that critical information appears before engagement drops.
- Mouse Movement Tracking helps businesses understand how visitors interact with content, even when they don’t click.
- Macro Conversion Report pinpoints which elements drive conversions, allowing businesses to optimize critical CTAs.
By integrating Plerdy’s website metric tracking, businesses can refine their pages, reduce drop-offs, and create a seamless user experience.
5. Average Session Duration – Are Users Interested in Your Website?
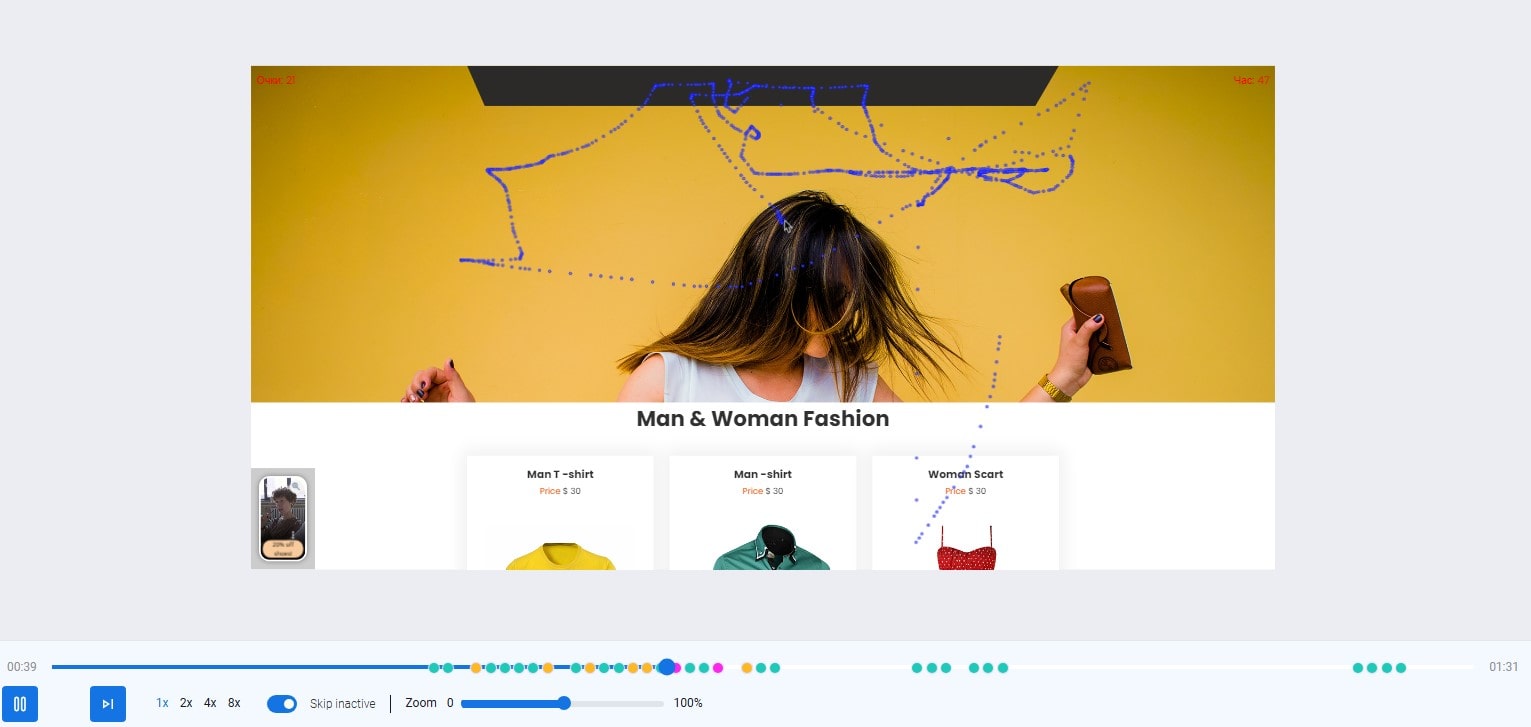
AI UX Assistant: Smart UX Optimization with Plerdy
Understanding user experience (UX) is crucial for website performance and conversion growth. Plerdy’s AI UX Assistant automates this process, analyzing real user interactions to uncover areas for improvement.
- This tool processes heatmap data, video sessions, and behavioral metrics, helping businesses identify friction points.
- Instead of guessing what’s wrong, AI-generated insights guide businesses on where to make adjustments for better engagement and conversions.
- Whether improving navigation, CTA placements, or content layout, AI UX Assistant makes website UX optimization effortless and data-driven.
Tracking UX metrics ensures businesses keep visitors engaged, reducing bounce rates and improving overall customer journey experiences.
Plerdy A/B Testing: Data-Backed Website Decisions
Every website change impacts user behavior, but without testing, businesses risk guesswork-based decisions. Plerdy’s A/B Testing tool helps track what actually works by comparing different website variations.
- Businesses can test design changes, CTA positions, pricing displays, or content structure to measure their impact on conversions.
- Instead of implementing site-wide modifications based on intuition, real-time metrics from A/B testing show which variation performs better.
- Higher engagement, increased sales, and improved user experience are direct benefits of regular A/B testing.
Tracking A/B test results ensures business websites continually optimize for user preferences, making every update data-backed and conversion-focused.
6. Click-Through Rate (CTR) – The Engagement Metric Every Business Needs
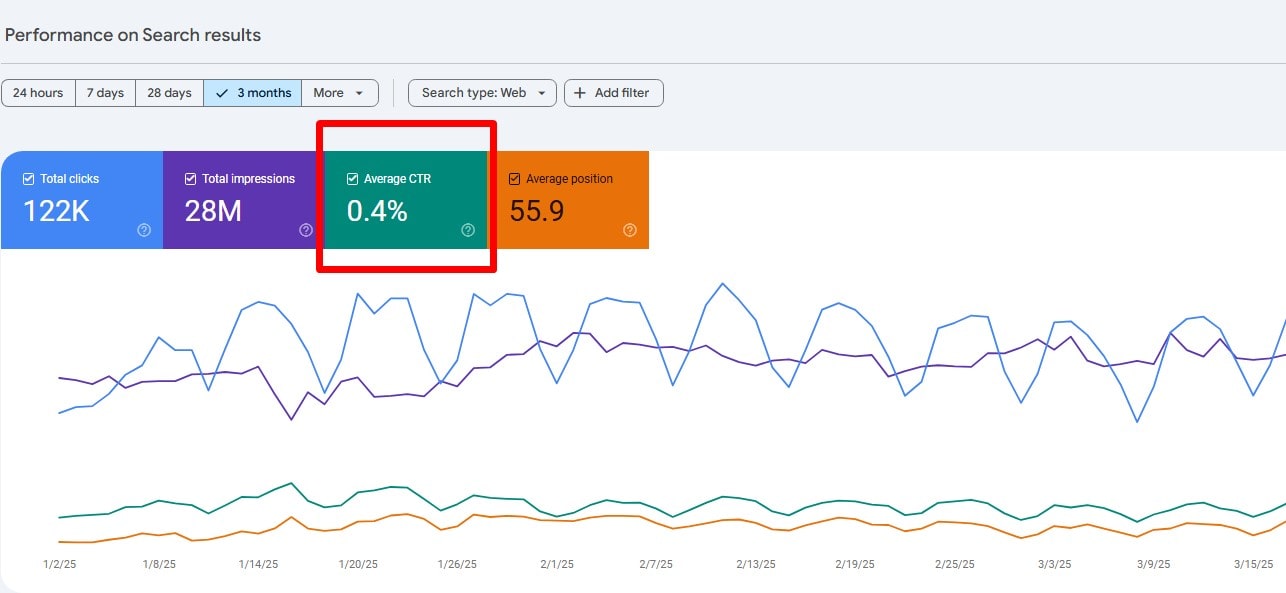
CTR measures how often users click on your website’s buttons, links, and CTAs. If your CTR is low, your messaging isn’t compelling enough.
Plerdy A/B Testing: Data-Driven Optimization
Making website changes without measuring results is a gamble. Plerdy’s A/B Testing Tool allows you to test page versions, CTA buttons, and design elements to see what boosts conversions.
- Test headlines, buttons, colors, and UX design without traffic limits.
- Monitor performance metrics in real time and adjust based on actual user behavior.
- Detailed reports help analyze which changes improve engagement and drive business growth.
Plerdy Heatmaps: Deep User Behavior Insights
Plerdy Heatmaps provide a clear picture of how visitors interact with your website, helping businesses optimize user journeys.
- Click Maps reveal which buttons, links, and elements attract the most engagement.
- Scroll Depth Tracking shows how far users scroll, helping place key content effectively.
- Mouse Movement Analysis helps identify what catches user attention before they click.
Pop-Ups: Convert Visitors into Customers
Boost engagement and sales with Plerdy’s Pop-Up Software, designed to capture leads, promote offers, and collect feedback.
- Lead Generation Forms help gather emails and drive email marketing campaigns.
- Promotional Pop-Ups highlight special deals and increase sales.
- Exit-Intent Pop-Ups reduce bounce rates by offering last-minute incentives.
With Plerdy’s A/B Testing, Heatmaps, and Pop-Ups, businesses can track key website metrics, understand user behavior, and implement strategies to maximize conversions.
7. Exit Pages – Where Your Business Website Is Losing Customers
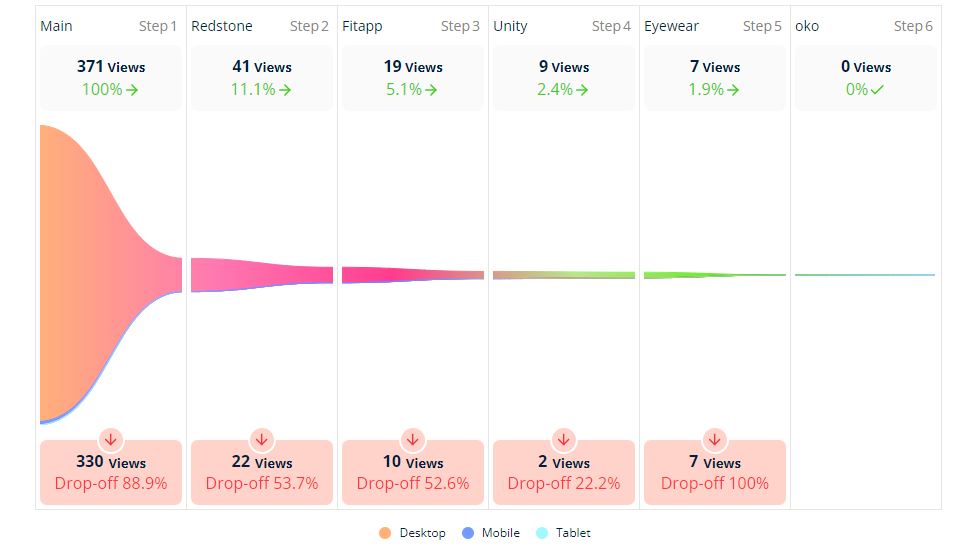
An exit page metric shows you the last page a user visits before leaving your website. If key pages, like checkout or pricing, have high exit rates, your business is losing conversions.
Plerdy’s Solution for High Exit Page Metrics
- Session Replays provide detailed insights into user interactions, helping businesses analyze why visitors leave specific website pages.
- Plerdy Funnel Analysis pinpoints drop-off stages in the conversion process, allowing businesses to optimize critical touchpoints.
- Exit Intent Pop-ups engage users at the last moment, offering discounts, lead forms, or personalized messages to retain potential customers.
For example, an e-commerce business using Plerdy Heatmaps and A/B Testing can track visitor behavior metrics and refine page elements to reduce bounce rates. Optimized exit pages improve retention and boost conversions, helping businesses maximize website performance.
Additionally, Plerdy Pop-ups enable personalized offers based on visitor behavior, boosting engagement. Analyzing user scroll depth and click patterns through heatmaps provides actionable data for better website optimization and business growth.
Final Thoughts – Optimize Your Website Metrics with Plerdy
Tracking the right website metrics is what separates successful businesses from those that struggle. If you’re not measuring conversion rates, bounce rates, user behavior, and traffic sources, you’re making decisions in the dark.
Plerdy makes website metric tracking simple with heatmaps, funnel analysis, session replays, and A/B testing.
Want better business results? Start optimizing your website metrics with Plerdy today!
FAQ: Key Website Metrics Every Business Should Track
Why is tracking website metrics crucial for a business?
Tracking key website metrics is essential because it turns guesswork into data-driven decisions. By measuring metrics like conversion rate, bounce rate, and traffic sources, a business can understand user behavior and optimize its website for better engagement and revenue. These metrics provide actionable insights that help you identify strengths and areas for improvement on your website.
How does Plerdy help a business optimize its website metrics?
Plerdy offers a suite of tools that transform raw data into actionable insights for every business. With features such as website funnel analysis, heatmaps, session replays, and A/B testing, Plerdy allows you to pinpoint exactly where your website is succeeding or underperforming. These tools ensure that every website metric—from conversion rate to exit pages—is tracked and optimized, driving overall business growth.
What are the most important website metrics every business should monitor?
Every business should focus on several core website metrics:
- Conversion Rate: Indicates how many visitors take desired actions.
- Bounce Rate: Reflects user engagement and whether visitors are staying on your website.
- Traffic Sources: Reveals where your visitors come from, whether organic, paid, or referral.
- User Behavior: Measures interactions like clicks, scroll depth, and session duration.
- Exit Pages: Identifies where users leave your website, which helps in refining key conversion points.
Monitoring these metrics gives a complete picture of your website’s performance and guides effective optimization strategies.
In what ways do Plerdy’s tools enhance user behavior analysis on a website?
Plerdy’s tools are designed to analyze detailed user behavior. For example, heatmaps visualize user engagement across different parts of your website, while session replays show real user interactions in real time. This analysis helps businesses understand which elements are performing well and which need improvement, ensuring that the website is optimized for better user experience and higher conversion rates.
How does reducing bounce rate as a website metric benefit a business?
A lower bounce rate means that visitors are engaging with the content on your website rather than leaving immediately. By reducing bounce rate, a business can increase the time users spend on the site, boost interaction with key elements, and ultimately improve conversion rates. Plerdy’s tools help identify problem areas on your website, enabling you to make adjustments that keep users engaged and drive better business outcomes.
