
Imagine this—you launch a marketing campaign with high hopes. The landing page looks sleek, the ads are running, and traffic is pouring in. But wait… conversions aren’t happening. What’s the problem?
Without behavioral analytics, you’re left guessing. Are visitors getting lost in your marketing funnel? Is the CTA button in the wrong place? Are users bouncing because of an unclear offer? This is where Plerdy’s behavioral analytics turns guesswork into clarity.
By analyzing real user behavior, Plerdy gives marketers the data they need to optimize web pages, boost conversions, and refine strategies. Whether you’re struggling with engagement, drop-offs, or ineffective marketing campaigns, behavioral analytics shows you exactly where things go wrong and how to fix them.
Ready to supercharge your marketing with Plerdy’s behavioral analytics? Let’s dive in.
What Is Behavioral Analytics & Why It’s a Game-Changer in Marketing
At its core, behavioral analytics is about understanding how users interact with your website. It tracks every click, scroll, and hesitation to reveal what’s working and what’s not. But the real power of behavioral analytics lies in its ability to decode intent—why users behave the way they do.
Why Behavioral Analytics Is Critical for Marketing Success
- Optimizes marketing campaigns – Know which pages, ads, or CTAs actually convert.
- Improves website UX – Behavioral insights show where users drop off or get stuck.
- Boosts conversion rates – Understand user behavior to remove obstacles and streamline the buyer journey.
- Enhances ad spend efficiency – Stop wasting budget on ads that drive traffic but don’t convert.
With Plerdy’s behavioral analytics, you get real-time marketing insights to fine-tune your strategies based on actual user behavior. Instead of assumptions, you work with data-driven marketing decisions that lead to real results.
How Plerdy’s Behavioral Analytics Transforms Marketing
1. Heatmaps: A Visual Breakdown of User Behavior
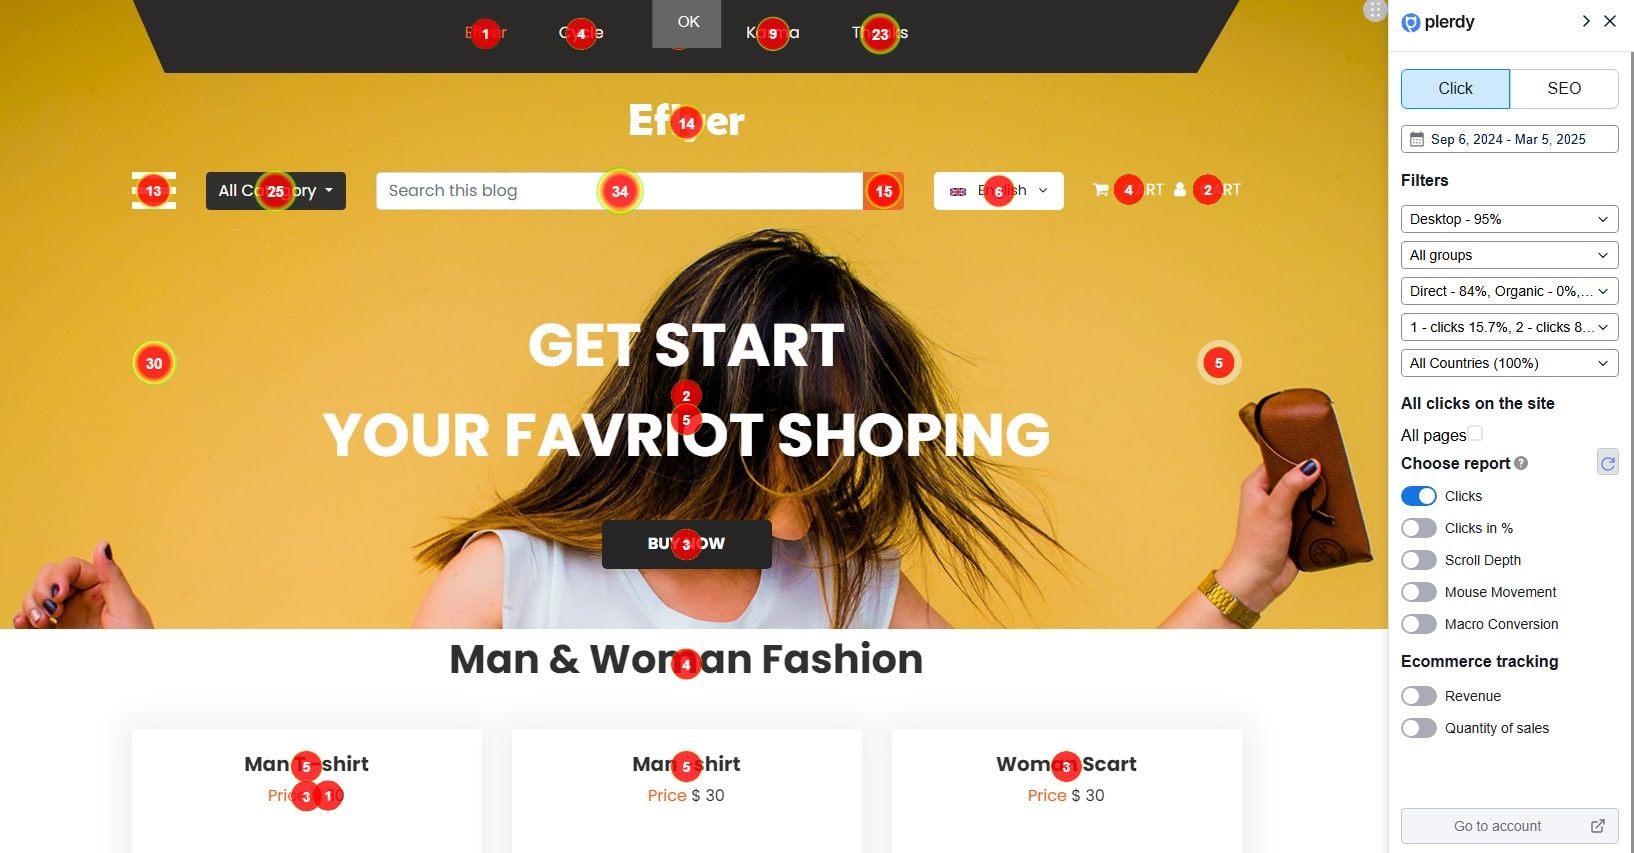
Heatmaps are a core feature of Plerdy’s behavioral analytics toolkit, offering marketers a detailed visual representation of how users engage with their website. By leveraging behavioral analytics, you can track and analyze user interactions with precision, ensuring every marketing decision is backed by data.
Here’s what Plerdy’s heatmap tracking reports can reveal:
- Clicks – Identify which buttons, links, or dynamic elements attract the most engagement. The Clicks in % report helps analyze clicks even in hidden or moving elements.
- Scrolling behavior – Plerdy’s Scroll Depth report divides each page into ten equal sections, allowing marketers to understand how far users scroll before bouncing. If key information is too low, visitors might miss it.
- Mouse movement – Many users don’t scroll immediately but hover over key sections. The Staying a Mouse report shows where visitors pause, revealing engagement zones.
A SaaS company using Plerdy’s behavioral analytics tools discovered that their main CTA was placed in a low-engagement area. After repositioning it above the fold, conversions increased by 32%.
For eCommerce marketing, Plerdy’s Macro Conversion and Revenue reports go further, showing which elements users click before making a purchase. If certain sections aren’t contributing to conversions, they can be optimized or removed. A fashion retailer used this feature to detect a high drop-off rate at the checkout stage. By adjusting CTA placement and clarifying shipping fees, they boosted sales by 18%.
Want to make smarter marketing decisions? Plerdy’s behavioral analytics heatmaps turn raw data into real growth.
2. Session Recordings: Watching Real User Behavior
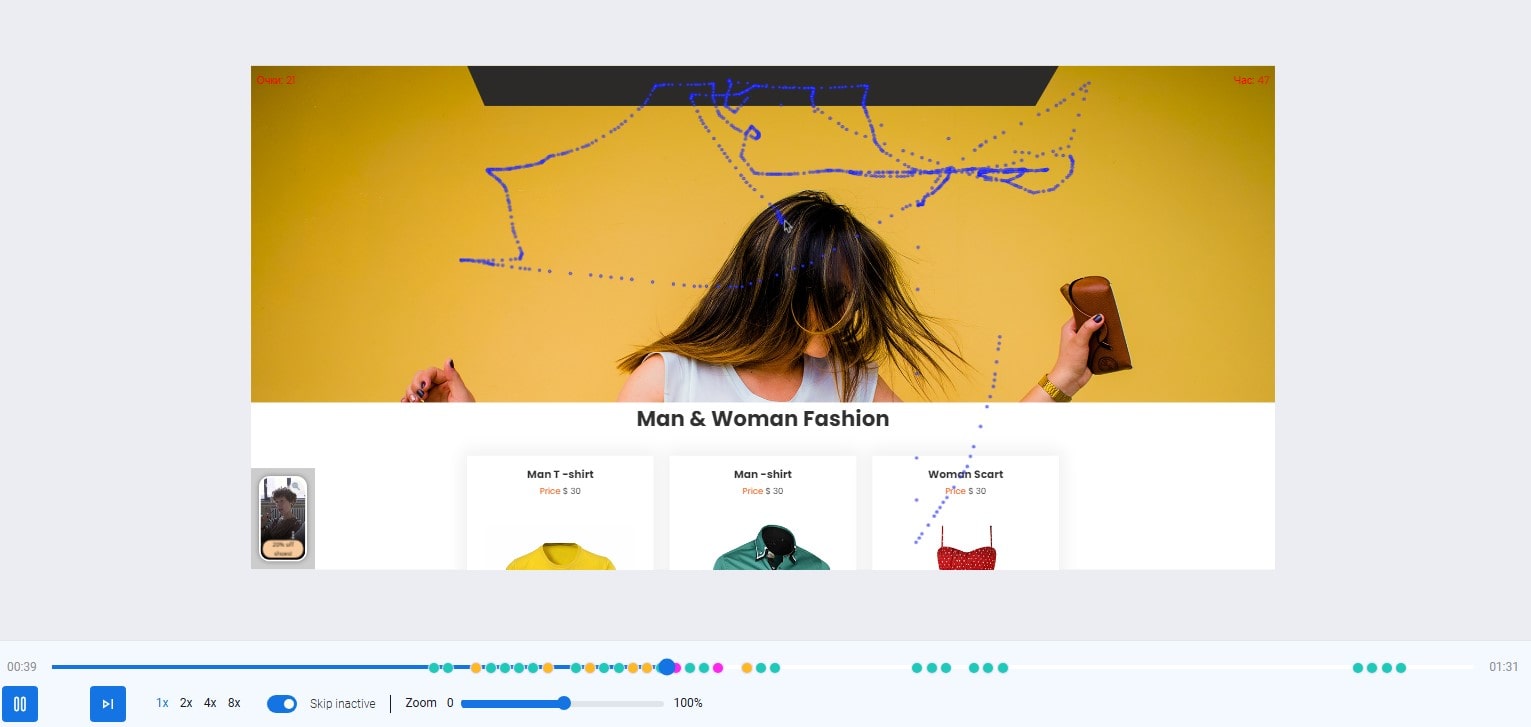
Heatmaps are great, but Plerdy’s session recordings take behavioral analytics to another level, letting you observe real users interacting with your site. Instead of guessing why visitors leave or fail to convert, session replays give marketers a front-row seat to user behavior.
Here’s what Plerdy’s session replay analytics can uncover:
- Where users hesitate or struggle – If visitors stop mid-action, something in your design or content is causing confusion.
- How visitors engage with marketing content – See whether users click key links, read important sections, or ignore crucial CTAs.
- Rage clicks and unexpected behavior – If users repeatedly click non-clickable elements, it signals frustration.
Setting Up Session Recordings in Plerdy
To start recording behavioral analytics data, configure Plerdy’s session replays with custom rules. You can:
- Enable video session tracking for all pages or specific landing pages in your marketing funnel.
- Set filters for traffic sources, device types, or geographic locations to analyze different audience segments.
- Automate deletion of old recordings or manually remove unnecessary videos.
One global eCommerce brand used Plerdy’s behavioral analytics to analyze why mobile users abandoned their carts. Session replays revealed that checkout buttons were too small on smaller screens, making it difficult to complete purchases. A simple UI fix led to a 28% reduction in cart abandonment and higher revenue.
For marketers using CRM systems, Plerdy allows integration with unique customer IDs, making it easier to find recordings of specific user journeys. This means you can track how a potential lead engaged with your site before signing up, helping refine future marketing efforts.
Want to improve your website’s UX and optimize marketing performance with behavioral analytics? Plerdy’s session recording tool delivers the insights you need.
3. Website Funnel Analysis: Fixing Drop-Off Points in the Marketing Journey
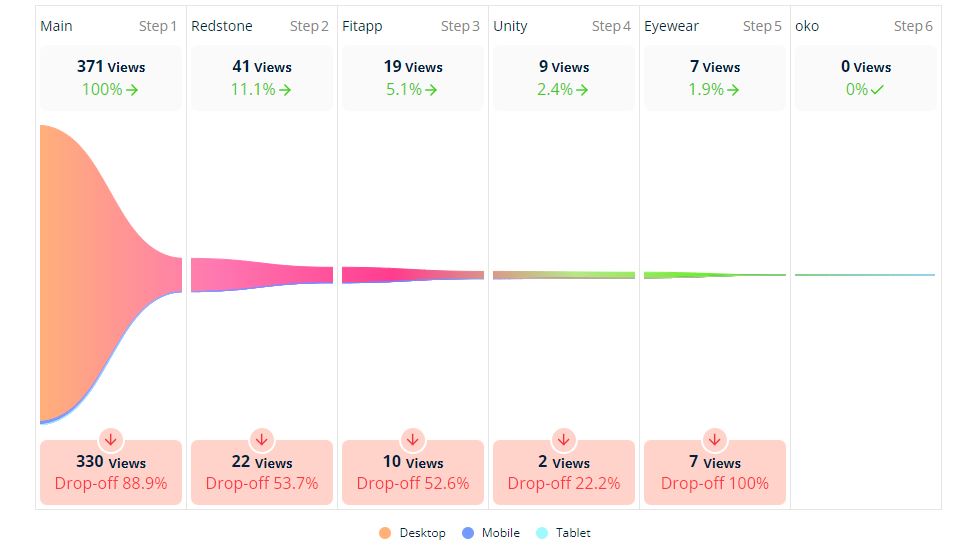
A well-optimized marketing funnel should seamlessly guide users from their first visit to conversion. But when visitors leave before taking action, it signals a critical issue. Plerdy’s behavioral analytics tools provide deep insights into each step of the funnel, helping marketers uncover and resolve friction points.
How Plerdy’s Funnel Analysis Optimizes Marketing Performance
- Identifies weak points – See where potential customers drop off before converting.
- Tracks user transitions – Understand how different audience segments navigate through the funnel.
- Optimizes each step – Improve pages that aren’t engaging enough or causing confusion.
Creating a Conversion Funnel in Plerdy
To analyze behavioral patterns and marketing performance, set up a funnel in Plerdy’s Website Funnel Analysis tool:
- Select the first target page – This is where users land from different traffic channels (e.g., an eCommerce category page).
- Add a second page – The next expected step in the journey, such as a product details page.
- Define the last step – Typically a checkout confirmation or “Thank You” page.
Each funnel step must be unique—if a stage repeats, the data may not provide accurate insights. Plerdy’s behavioral analytics ensures marketers detect funnel inefficiencies and apply targeted improvements.
For instance, an online retail store used Plerdy’s funnel tracking and noticed that 37% of users abandoned their carts after reaching the payment page. Session replays revealed that unexpected shipping costs caused hesitation. After displaying shipping fees earlier in the checkout process, conversions improved by 19%.
By leveraging Plerdy’s behavioral analytics and conversion funnel tracking, marketers can refine their sales process, eliminate barriers, and drive higher conversion rates with data-backed optimizations.
4. Event Tracking: Measuring Micro-Conversions in Your Marketing Strategy
![]()
Tracking micro-conversions is a crucial aspect of behavioral analytics, as it helps marketers understand which elements on a website drive engagement and influence purchasing decisions. Plerdy’s event tracking tool allows businesses to monitor user interactions with buttons, forms, pop-ups, and even dynamic elements—without requiring complex coding.
How Plerdy’s Event Tracking Optimizes Marketing Performance
- Monitors CTA effectiveness – Find out whether users actually click your most important buttons.
- Analyzes form engagement – Track how often users interact with your search bar or sign-up forms.
- Identifies high-impact elements – Determine which site components receive the most user attention.
Setting Up Event Tracking in Plerdy
To start tracking micro-events with behavioral analytics, marketers can:
- Add event tracking to key elements – For example, track clicks on the “Search” button or a product category link.
- Monitor recurring site interactions – If a button is present on multiple pages, analyze how engagement differs.
- Segment and prioritize events – Focus on high-impact interactions that contribute to your marketing goals.
A digital marketing agency used Plerdy’s event tracking to monitor CTA button engagement across different traffic sources. The data revealed that organic visitors clicked CTAs 18% more frequently than paid traffic users. With this insight, the agency adjusted its ad targeting strategy, improving conversion rates by 12%.
By leveraging Plerdy’s behavioral analytics, marketers can fine-tune website elements, optimize user journeys, and ensure every interaction contributes to long-term business growth.
Plerdy vs. Other Behavioral Analytics Tools
| Feature | Plerdy | Google Analytics 4 | Hotjar |
|---|---|---|---|
| Heatmaps | ✅ Yes | ❌ No | ✅ Yes |
| Session Recordings | ✅ Yes | ❌ No | ✅ Yes |
| Funnel Analysis | ✅ Yes | ❌ No | ✅ Yes |
| Event Tracking | ✅ Yes | ✅ Yes | ❌ No |
| UX Optimization Tools | ✅ Yes | ❌ No | ❌ No |
Unlike Google Analytics 4, which focuses on general website data, Plerdy’s behavioral analytics provides visual insights that directly improve marketing performance. Compared to Hotjar, Plerdy’s suite of marketing tools is more comprehensive, covering everything from user tracking to UX analysis.
Actionable Strategies to Leverage Behavioral Analytics in Marketing
1. Optimize Call-to-Action (CTA) Placement
Using Plerdy’s behavioral analytics, you can find the best spot for your CTAs by analyzing user attention zones.
✅ Example: A SaaS startup used Plerdy’s heatmaps to reposition their CTA based on user scroll depth. Result? A 20% increase in demo sign-ups.
2. Reduce Cart Abandonment with Session Recordings
Shopping cart abandonment rates hover around 69% worldwide. But behavioral analytics tools like Plerdy’s session recordings help fix this.
✅ Example: An eCommerce store noticed users hesitated at checkout due to surprise shipping costs. Solution? A free shipping banner. Result? A 14% revenue boost.
3. Run Smarter A/B Tests Using Behavioral Analytics
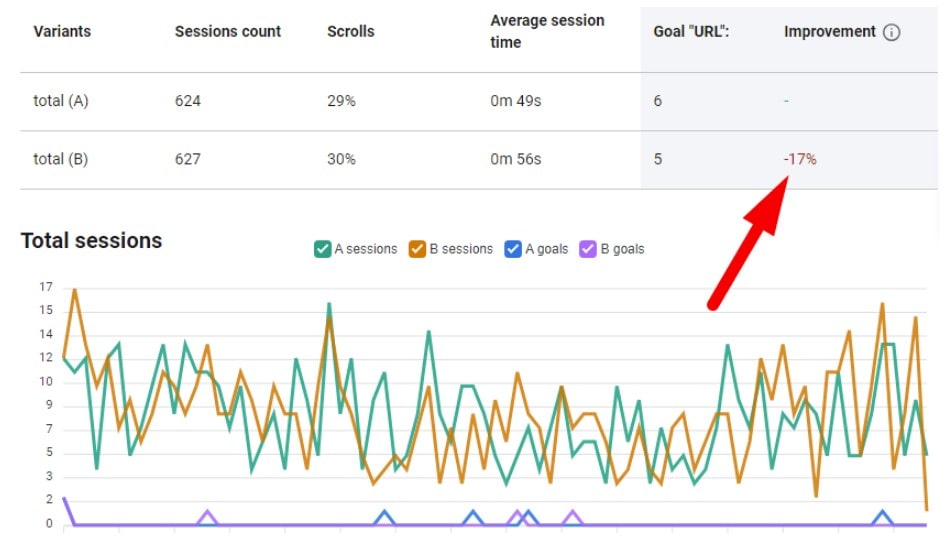
A/B testing is an essential tool for data-driven marketing, but without behavioral analytics, marketers are left making changes blindly. Plerdy’s A/B testing tool eliminates this uncertainty by providing real-time analytics on user interactions, allowing businesses to test different variations and see what actually works.
How Plerdy’s A/B Testing Enhances Behavioral Analytics
- Unlimited traffic testing – No restrictions on page views for test or target pages.
- Flexible experiment setup – Modify elements like button color, text size, or layout directly in Plerdy.
- Goal tracking integration – Set conversion goals, such as clicks on CTAs or visits to key pages.
✅ Example: A SaaS company ran an A/B test on their landing page using Plerdy’s behavioral analytics. The test compared a single-step vs. two-step form submission. The data showed that the two-step form led to a 25% increase in conversions, proving that breaking tasks into smaller steps boosts user engagement.
With Plerdy’s A/B testing and behavioral analytics, marketers can optimize website performance, increase conversions, and refine marketing strategies with precision.
Key Takeaways
- Behavioral analytics eliminates marketing guesswork.
- Plerdy provides real insights into user behavior, from heatmaps to session recordings.
- Marketing success depends on data-driven optimizations, not assumptions.
- Real-world use cases prove that leveraging Plerdy’s behavioral analytics boosts conversions.
If you want higher engagement, lower bounce rates, and smarter marketing strategies, it’s time to let Plerdy’s behavioral analytics do the heavy lifting. Try it today and turn visitor insights into real marketing growth!
FAQ: The Power of Behavioral Analytics in Marketing – Actionable Insights
What is behavioral analytics, and why is it important for marketing?
Behavioral analytics focuses on understanding how users interact with your website. In marketing, it helps uncover why visitors behave a certain way, revealing critical insights that boost engagement, optimize strategies, and increase conversions.
How does Plerdy’s behavioral analytics improve marketing performance?
Plerdy’s behavioral analytics tools, like heatmaps and session recordings, give marketers real-time data on user behavior. This allows businesses to identify weak points, optimize UX, fine-tune CTAs, and create data-driven marketing campaigns that drive real results.
What makes Plerdy’s behavioral analytics different from other tools?
Unlike platforms like Google Analytics 4, which focus mainly on general metrics, Plerdy offers detailed behavioral analytics—heatmaps, funnel analysis, and event tracking—designed specifically to empower marketing teams with actionable insights for immediate improvements.
Can Plerdy’s behavioral analytics help reduce cart abandonment?
Yes! By analyzing user behavior through session recordings and funnel analysis, Plerdy pinpoints where users drop off during the checkout process. Marketers can then fix these friction points, reducing cart abandonment and increasing revenue.
How easy is it to set up behavioral analytics with Plerdy for marketing teams?
Setting up Plerdy’s behavioral analytics is straightforward. You can track events, record sessions, analyze heatmaps, and build marketing funnels without complex coding—making it perfect for marketers who want powerful insights without the technical headache.