Explore the vast universe of the internet through the lens of web analytics?. Unravel the intricate dance between your website and its visitors, interpreted through the rhythm of data. Web analytics serve as your guide, spotlighting trends, behaviours and demographics, essential for understanding your audience’s actions on your website.
Navigate specific niches using web analytics:
- Restaurants: Identify popular dish pages, feeding your marketing strategies
- Healthcare: Uncover most sought-after services, tailoring patient care
- Education: Unearth popular courses, refining curriculum offers
Web analytics weaves a story from the fragments of data left by visitors. Whether it’s a swift click or lingering scroll, these actions feed into your website’s overall narrative, sharpening your customer understanding and strategies.
Unleash the power of Plerdy tool for comprehensive CRO & UX, shaping your website into an inviting, user-centric space. With Plerdy, turn every pixel of data into a crucial piece of the puzzle, fostering growth and retention.
Pivot from the abstract and plunge into the concrete with web analytics – a compass for your digital journey, pointing out opportunities, signaling potential pitfalls, and setting the course for a successful online voyage.
What Is Web Analytics and FAQ?

Web analytics is a complex area aimed at obtaining and processing data about traffic to your website. Web analytics is designed to help you understand why web traffic remains at the same level and what content interests visitors.
Using all the tools provided by web analytics, you can track the success and effectiveness of changes on the website.
Web analytics requires a massive amount of time and effort since it is necessary to compare details with the previous ones and obtain the essential indicators. Based on the data received, you can evaluate the website’s success. Search engines create special services, such as Google Analytics, to make it easier for web analytics, but the available tools of such services are only sometimes sufficient.

Working with web analytics, depending on the tool, marketers ask questions:
- How does Google Analytics track user behavior on a website ?
- What are the two main types of web analytics?
- What are the two main categories of web analytics?
- How to explain web analytics?
- How is web analytics used in the context of marketing?
That is why some companies are launching tools to expand the toolkit and Google Analytics data. One of these services is Plerdy.
- Understanding User Behavior: Web analytics shows what pages visitors visit, how long they stay, and what actions they do.
- Optimizing Marketing Efforts: Web analytics can help track marketing campaigns’ effectiveness and determine website traffic sources, allowing marketers to optimize their efforts and allocate resources more effectively.
- Improving Conversion Rates: By analyzing data such as the paths users take through the site, the time they spend on specific pages, and the actions they take, website owners can make improvements to increase conversion rates.
- Measuring Website Performance: Web analytics gives page load times, bounce rates, and other metrics to optimise a website.
- Making Data-Driven Decisions: Tracking analytics helps website owners make better judgements.

Plerdy is a great Google Analytics add-on that can tell you more about web traffic and the reasons for its growth. It can help solve the problem that appeared on the website since Plerdy is a complex of analytics tools consisting of:
- A heatmap tracking tool
- Tool for pop-ups
- SEO Optimization Checker Tool
- Tracking user sessions
- Monitoring events and targets
- Analyzing the effectiveness of e-commerce
- Tracking the conversion sequence
To better understand why Plerdy is needed, you first need to learn more about the web analytics concept.
Example and Explanation of Web Analytics

Web analytics is like counting the number of people on your website who came to a party and tracking what they did while there.
The following information about website visitors may be useful:
- How many people came to the party (number of site visitors)?
- Which corners of the dance floor were the most popular? (heatmap data)
- Which bars were the most popular? (most visited pages or page views)
- How long did people stay at the party? (time spent on the pages)
- Where did people come to the party from? (traffic channels)
- What did people do while they were at the party? (user behavior)
- Photos and videos on the social network of this institution? (like recording video sessions)
It’s like using a detective hat and magic glasses to see who came, where they came from, what they did and even how long they stayed at the party!
Digital Marketing Web Analitycs Examples
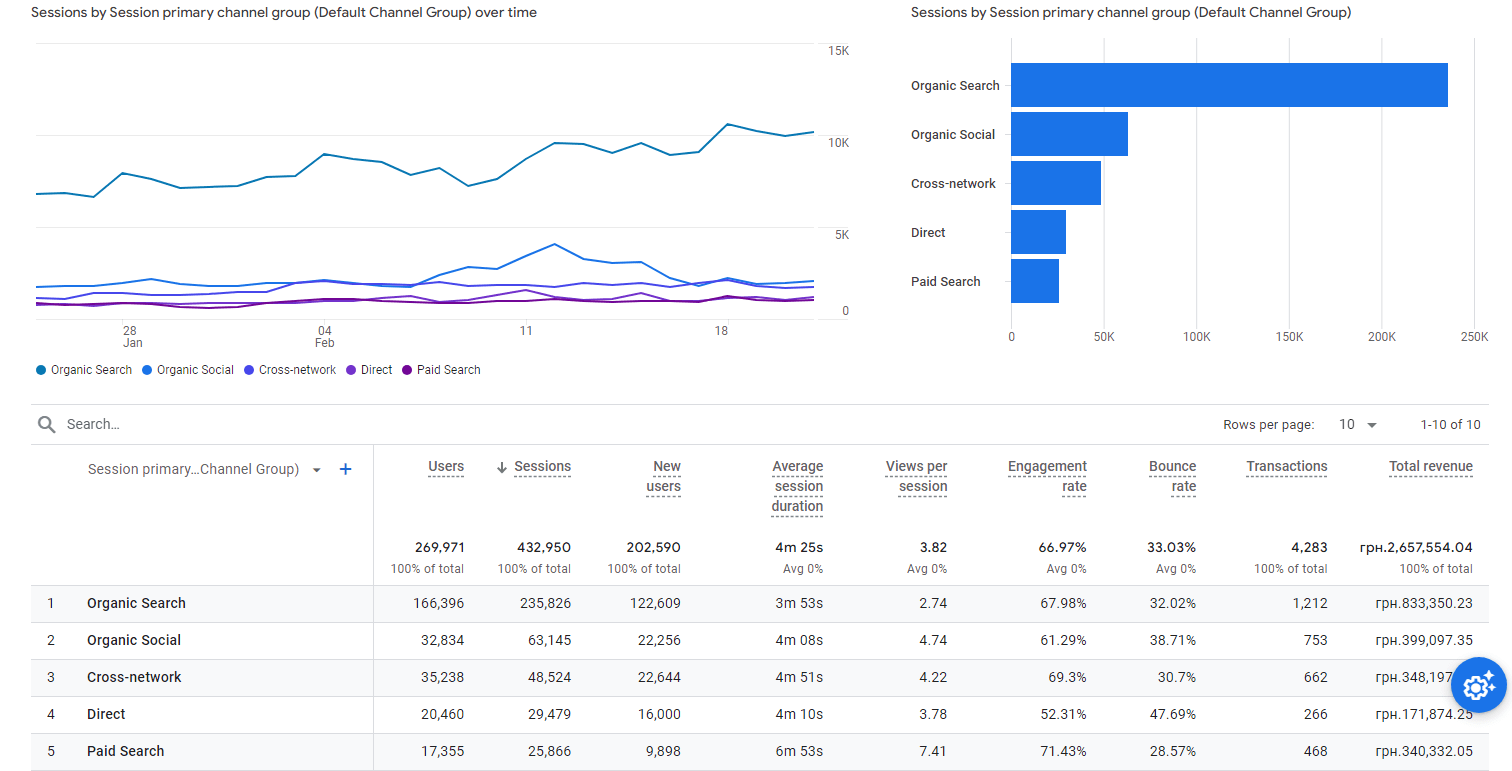
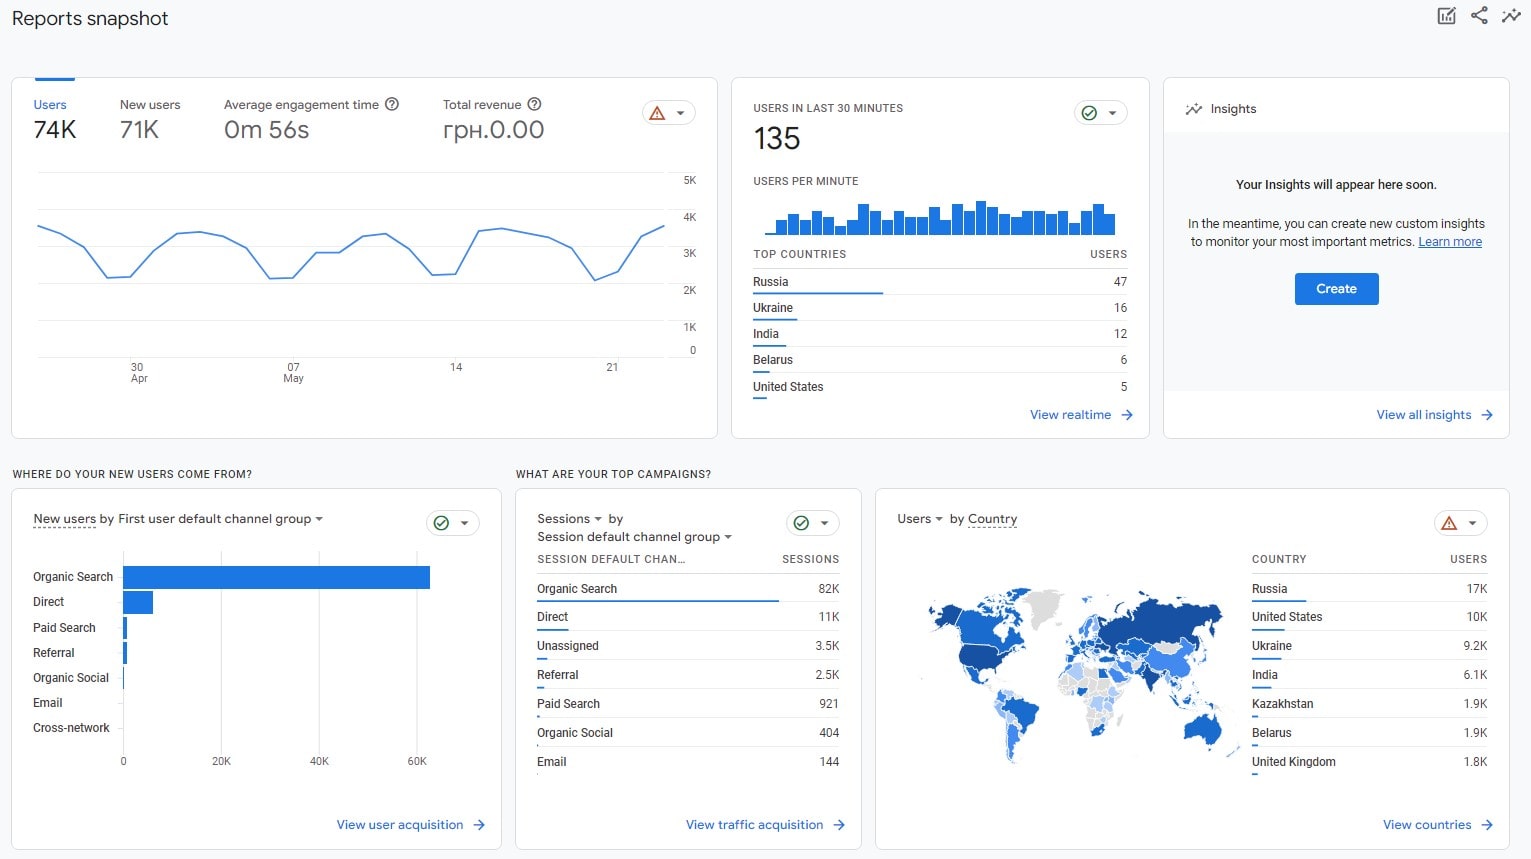
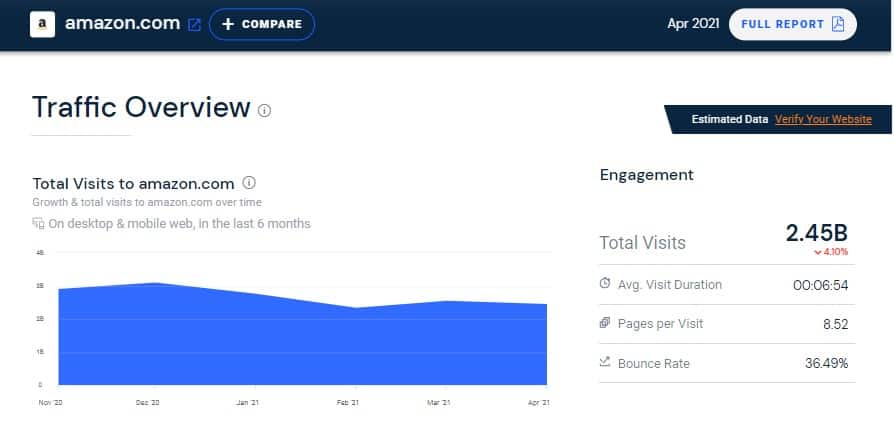
Web analytics is very voluminous; you need a visual example. To make it more comfortable for the users toanalyze the published data and their volumes, we decided to display them in graphs, which indicate all the information obtained via web analytics.
Web analytics is used to analyze user experience (UX) statistics. We have made conclusions based on data collected from thousands of websites. They show typical behaviors that you should consider to optimize your user experience.
Web analytics of clicks by device

Web analytics of the scroll

Web analytics of scrolling through pages shows that many visitors do not reach the bottom of the page (footer). Thus, if you place vital elements too deep (like contact forms, testimonials or certificates), no one will see them. Therefore, collect scroll data to offer optimal UX and locate important buttons or blocks + calls to action or menus within the first screens.
Web analytics data without clicks

Web analytics data showingusers who did not click on the site page. On the screenshot, you can see that about half of user sessions are without clicks. It means a person visits the page, sees its content, scrolls down and reads but never clicks and leaves the page. The reasons are usually different, so you need a user experience (UX) analysis. Your site may miss important information, have the wrong headline or banner, have unconvincing calls to action, or have bugs on the first screen.
Common Iissues with Web Analytics
Web analytics can be as challenging as reading a map in hieroglyphics. Understanding so much data might be overwhelming. It’s like trying to find a needle in a haystack!
One of the common problems with web analytics is the problem of “data overload,” where you are inundated with a flood of numbers, statistics and graphs that make your head spin. In this case, you should use Google Data Studio or other tools.
Another problem is the “data sampling” problem, where you try to draw conclusions based on a small sample of data. You need to complete the big picture and will fail to put it together correctly. It is common in Google Analytics.
Experts such as Avinash Kaushik, the “Web Analytics Evangelist,” and Brian Clifton, a leading authority on web analytics, often advise having clear goals and objectives and establishing a clear strategy and measurement plan. Without these steps, they say, it’s like trying to bake a cake without a recipe and ending up with a mess. Like a detective solving a case, use quantitative and qualitative data and comprehend the context in which it was acquired. Then, with the right tools and approach, you can uncover the valuable information in the data and move to new heights of success.
Web Analytics Benefits
The success of any business depends on many factors. The most critical success factors are receiving, interpreting, and analyzing.
Tracking bounce rates and engagements
Web analytics provides numerous benefits in tracking a website’s performance. One of the most important ones is measuring bounce rate and engagement. Bounce rate measures the percentage of visitors who leave a website after only visiting one page, while engagement is an overall measure of how much a user interacts with elements. These measurements can help identify issues and optimize content and design to improve user experience, reduce bounce rate, and increase engagement, leading to higher conversion rates and better ROI.
Ability to track the success of marketing campaigns
At the same time, having seen the most unprofitable campaigns or those with low-performance indicators, an entrepreneur can stop financing them, thereby balancing their advertising budget.
Work on optimizing conversion rates
Web analysts can track web traffic indicators and user actions by working with the website and motivating potential buyers to complete practical tasks. Conversion rate = conversions / users.
Web analysts can determine which actions are the most popular and why they respond better than others by analyzing user actions. Considering this data, specialists can motivate users to perform other actions to develop the business.
Ability to measure success in achieving the goals set
Web analytics tools allow you to track specific indicators the web analyst is interested in growing. Tracking the indicators chosen by the entrepreneur as goals can bring results thanks to constant monitoring of the situation and timely introduction of edits to the website.
Space for new ideas
Coming up with a new yet effective marketing campaign is difficult, especially if there is no data to guide you. Web analytics can help generate new ideas. Moreover, entrepreneurs can make their advertisements more effective using the data obtained because it will make it possible to understand what motivates users to click or take a targeted action more effectively.
These are not all the positive aspects of web analytics, but they are enough to think about for its launch.
How to Set up Web Analytics?
Consider two corporate web analytics setup samples. Follow the steps below, and let’s go.
Google Analytics 4

There are a few steps you can follow to add Google Analytics 4 (GA4) tracking code to your website:
- Create a GA4 property in your Google Analytics account by going to the Admin section and selecting the “Create Property” button.
- Once you’ve created your GA4 property, you’ll receive a tracking code that begins with “G-.” This code is unique to your GA4 property and should be added to the website.
- You’ll need to access the theme (or use a plugin for WordPress, Shopify, or Google Tag Manager). It typically involves logging into your CMS or accessing the code through FTP (SSH).
- Once you have access to the code for your web pages, you’ll need to add the GA4 tracking code to each page you want to track. It is typically done by pasting the tracking code into the header section of the page’s code.
- After adding the GA4, you’ll need to wait for data to appear in your GA4 reports (by checking the real-time report). It can take 24-48 hours for data to start appearing in your reports.
- An additional step is to set goals if you want to track specific user actions (events) on elements, such as form submissions or button clicks. You can do this in your account’s GA4 “Goals” section.
Please note that these steps provide a general overview of the process for adding GA4 tracking code to a website. The specifics may vary depending on your website’s content management system or hosting platform. Check the Google Analytics official site for more detailed instructions and best practices.
Plerdy web analytics
For advanced and more detailed information, a web analyst, digital marketer or business owner can create a Plerdy account to collect data on user behavior on the pages. Follow the steps:
- Create a Plerdy account.
- Add a link to your domain.
- Follow the prompts, and you will find the Plerdy tracking code to add to your CMS according to the instructions.
- Next, go through all the onboarding steps, and you will find examples of setting up Plerdy reports.
Using Google Analytics in conjunction with Plerdy, specialists can significantly increase the amount of information received for analytics and take a closer look at the metrics and aspects of each page.
The Main Channels of Web Analytics Traffic

Web traffic is the website visitors’ volume and the data they receive and send. By analyzing this data, specialists can predict which traffic channels to develop.
As for the web traffic channels themselves, the list of the main ones is as follows:
- Organic traffic measures the number of users who have found a website using a search query by Google or Bing.
- Paid traffic – this type of web traffic includes all traffic of users who came to the website after the advertising campaign. One of the leading providers of paid traffic is Google ADS.
- Direct traffic – this traffic includes all visits made via a direct link.
- Referral traffic – this web traffic includes all users visiting the website following links. The web traffic that crowd marketing brings is referred to as referral traffic. The user is interested. Using referrers can hide the referrer information.
- Social traffic – as the name suggests, this traffic represents users who have visited your URL using links posted on social networks.
Each listed traffic channel can bring results, but its effectiveness often depends on the niche chosen for the business. Therefore, entrepreneurs should focus on several traffic channels best suited to the business niche to achieve maximum traffic results.
Visitor Tracking as Part of Web Analytics

Tracking visitors is a process that allows digital marketers to know who their visitors are, where they are, and how they got to the landing page.
By analyzing different segments of the target audience who have visited the URL, experts can identify users who are most interested in purchasing a product or ordering a service.
Web Analytics and How to Check Visitors
Tracking web visitors in realtime allows web analytics to track who is currently visiting the website.
The Plerdy software can help digital marketers obtain information about users.
Whether the users who visited the website are known or anonymous, Plerdy will track their activity when users still decide to make a purchase.
Tracking visitors and their actions on the page can make it possible to:
- Encourage multiple purchases and subscriptions.
- Eliminate all factors that could prevent the user from making a purchase.
- Get a massive amount of information, and analyze it correctly to predict customer behavior and influence it.
A Plerdy heatmap is a tool that helps web analytics get a visual representation of how visitors interact with a website. By collecting and displaying data such as clicks, scrolls and mouse movements on a webpage, the Plerdy heatmap allows web analysts to gain valuable insights into user behavior and identify areas of improvement on the website.
Some examples of how Plerdy heatmap helps web analytics are:
- Identifying user engagement: The heatmap provides a visual representation of how users interact with different elements on the website, such as buttons, links and images, which can help analysts understand which elements are getting the most engagement and which are not.
- Understanding user behavior: Plerdy heatmap can provide data on user behavior such as click patterns, mouse movement and scroll depth. With this information, analysts can identify any website layout and design issues that need improvements or may hinder user experience.
- Optimizing UX design: By identifying which elements on the website are getting the most engagement, the Plerdy heatmap helps optimize the website’s design and layout to improve user experience and increase conversion rates.
- Identifying page issues: By analyzing Plerdy heatmaps, web analysts can determine which pages are causing the most issues. It can help focus the optimization efforts, resulting in a better user experience.
- Evaluating UI redesigns: Plerdy heatmap can measure the impact of redesigns or updates on user behavior, allowing professionals to make data-driven decisions and improve the website over time.
All this data helps UX specialists find those mistakes and improve UX, increasing sales and macro conversions.
Recording sessions of website visitors from Plerdy allow you to:
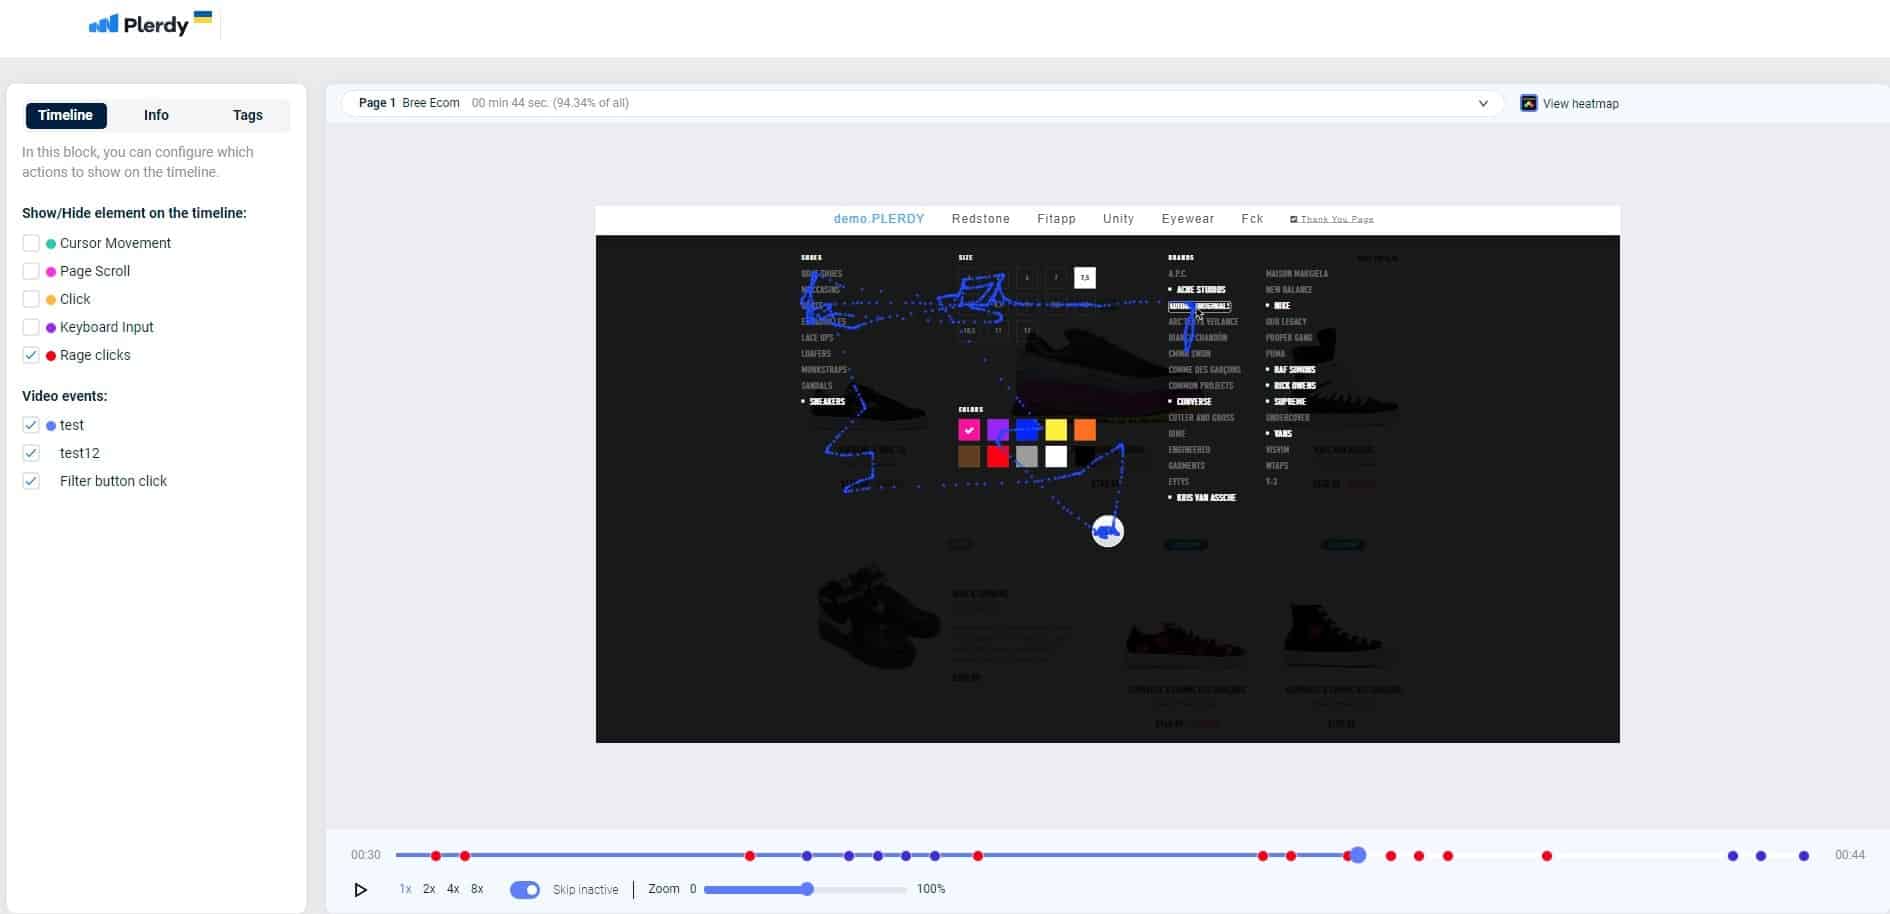
- Plerdy video recording sessions help web analytics discover how users interact with a page by providing visual recordings of users’ mouse movements, clicks and keystrokes.
- Web professionals can identify usability, navigation, and user flow issues. It includes understanding drop-off points, identifying usability issues, tracking user behavior and improving the website’s layout and design.
The digital specialist will improve the engagement using the data obtained from recording sessions. Moreover, analyzing user behavior can help the digital expert find out what causes users to abandon interaction with the pages.
Web Analytics Best Practices
Best practices in web analytics involve combining tools and techniques to understand user behavior and website performance comprehensively. Some of the best practices recommended by top experts include:
- Setting clear goals and objectives: Success requires a defined website goal.
- Implementing tracking tools: Use analytics tools, such as Google Analytics or Plerdy, to track and measure key metrics like traffic, bounce rate, conversion rates, and user behavior.
- Segmenting data: Break down your data into smaller segments to better follow user behavior and identify patterns and trends.
- Combine quantitative and qualitative data: Use both quantitative and qualitative data to understand user behaviour.
- Keep an eye on your competitors: Take time to monitor your competitors’ website analytics to identify new opportunities and improve your website’s performance.
- Regularly review and validate data: Make a habit of reviewing and validating data to ensure its accuracy and relevance and to identify any discrepancies that could affect your conclusions.
Tools like Plerdy, Piwik, Adobe Analytics, IBM Digital Analytics, Yahoo Web Analytics, Clicky, etc., are great analytics tools that offer rich features and functionalities to track and measure a website’s performance effectively. These tools can help you make data-driven decisions and improve website usability.
Conclusion
Experiencing the digital hustle from a different perspective, web analytics creates a panorama of your website’s interaction with its visitors, spun from the thread of data. It’s not about peeping into the user’s privacy, but about understanding the real needs of the visitors to offer them a tailored experience ⚡.
Like a seasoned chef who knows what spices will make the dish sing, web analytics provides you with precise ingredients to refine your online strategy. Make use of tools like Microsoft’s Azure or Plerdy’s heat maps, or the more granular analytics provided by Fullstory to stay on top of the game.
Powerful solutions such as the Plerdy tool come into play to offer a detailed SEO & UX analysis that propels your website into the stratosphere. Navigating the IP addresses, browsing histories, clicks, and computer usage, it paints a picture from the scattered puzzle pieces of data ⚡.
Dive into this ocean of information, install plugins, examine logfiles, and address potential issues, while ensuring you abide by the guidelines of third-party vendors. Make use of dashboards and embedded scripts to optimize the flow and ensure smooth sailing across the digital sea ?⚓️.
Each visitor leaves a trace, a statement of their journey through your website. Be it an ecommerce store, a news portal, or a personal blog, interpret these signals, convert insights into action, and facilitate a seamless user experience with the power of web analytics ⚡. With tools like Plerdy, set the stage for success, ensuring your website stays in high regard. Let the data drive your decisions, giving you the advantage in the digital arena.
