
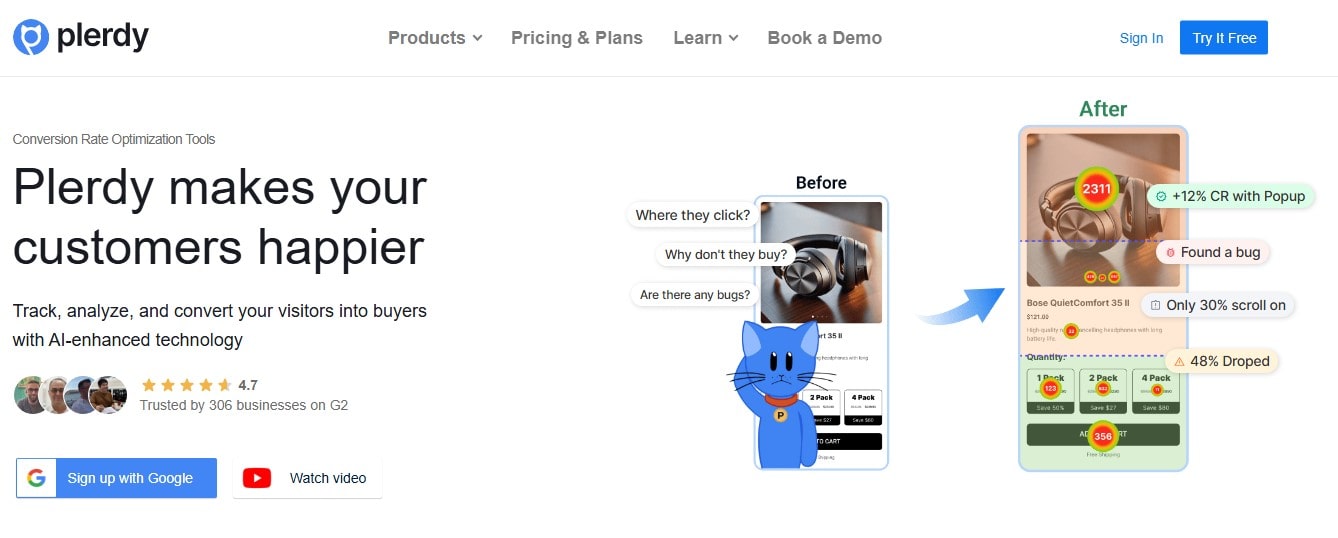
You check website metrics every day, right? Traffic goes up, traffic goes down. You feel happy when Google Analytics shows more visitors. But let’s get honest for a moment—are these traditional metrics really helping your website grow? Are they enough to make you smarter about what’s truly happening on your website? Probably not. That’s why I’ll show you why advanced website analytics tools—especially Plerdy—are exactly what you need to dominate online.
Why Traditional Metrics Aren’t Enough for Your Website Anymore
Traditional website metrics, like visitors, bounce rate, and sessions, look pretty cool in reports. You know, like those shiny dashboards from Google Analytics that your boss loves. But here’s a little secret—they don’t tell you why visitors are leaving, why they didn’t click “Buy,” or why they spent only 20 seconds scrolling.
You could have 10,000 visitors on your website, but if only 50 bought something, traditional metrics don’t say clearly what went wrong. They just show numbers and leave you guessing. That’s why you often feel stuck—lots of visitors, but very few sales. It’s like knowing exactly how many guests came to your birthday but not why half left after five minutes.
What Makes Plerdy Website Analytics So Powerful?
Now let’s talk seriously (but still friendly!) about why tools like Plerdy beat traditional website metrics. Plerdy isn’t just another analytics tool—it’s your super-smart assistant that shows exactly what visitors do and why they do it. It’s easy, fast, and actually helpful. Here’s how:
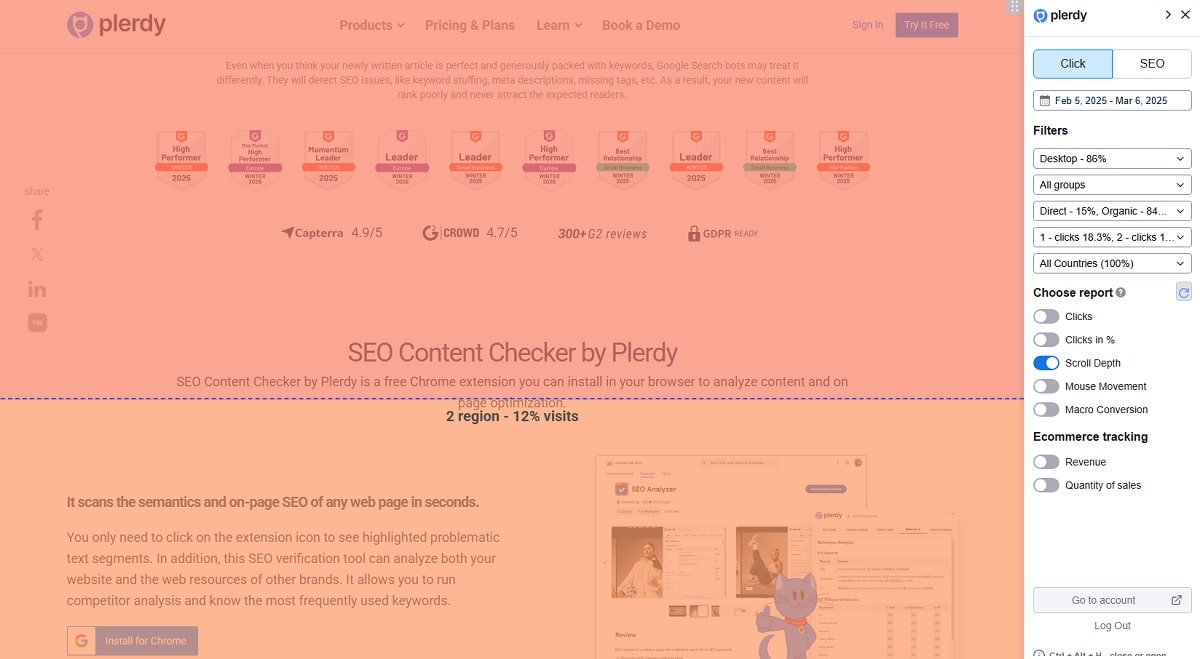
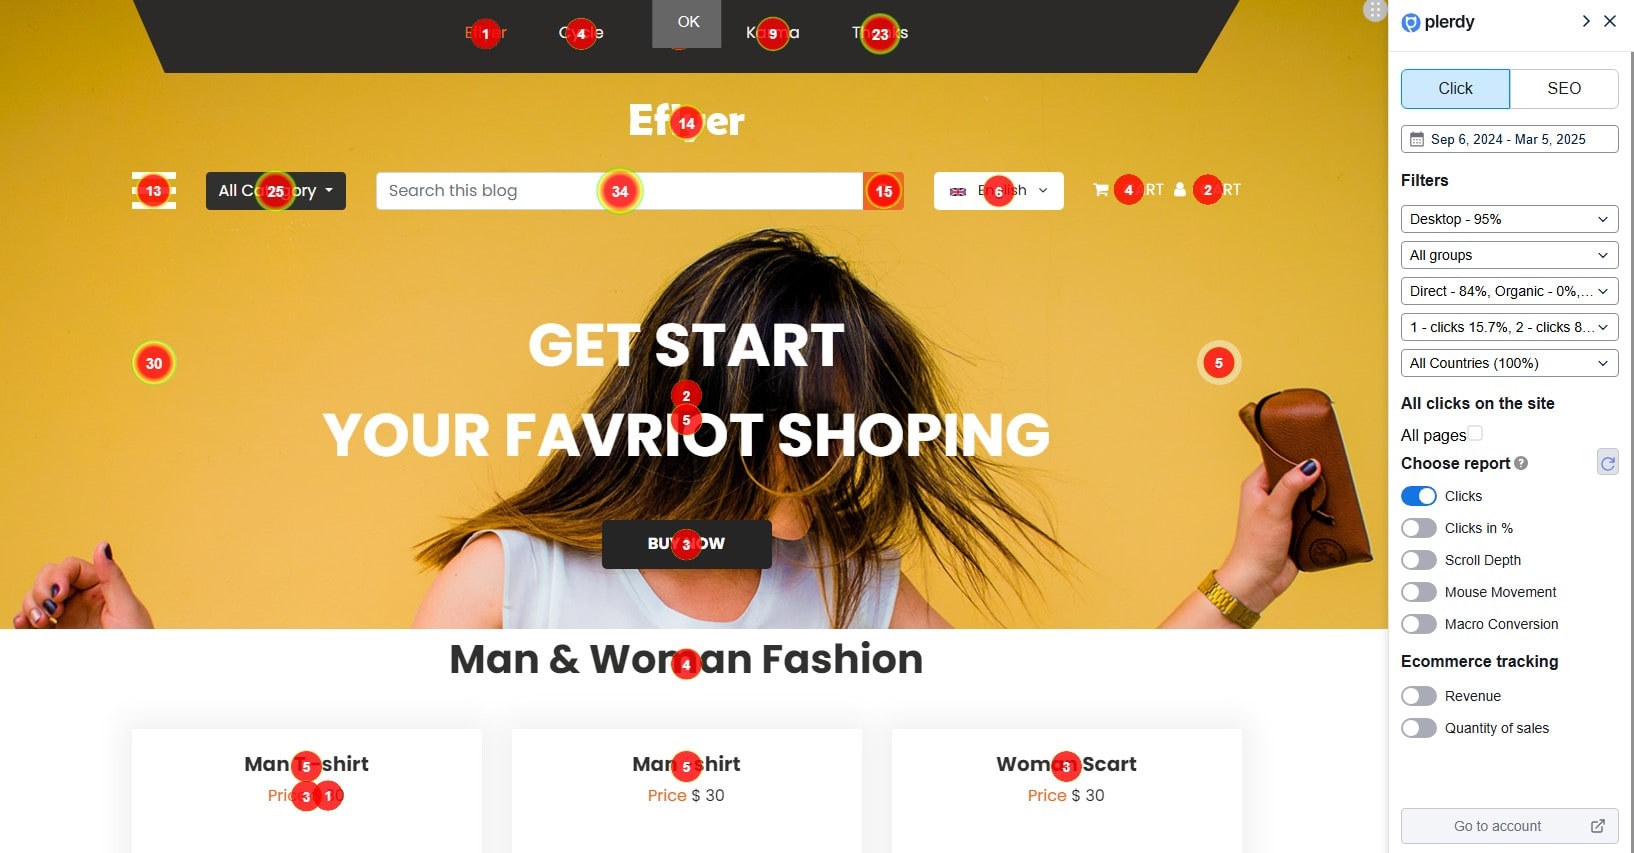
- Heatmaps: Traditional metrics won’t tell you why no one clicks your “Buy Now” button, but Plerdy heatmaps will show exactly where visitors click instead. For example, let’s say your visitors constantly click a random image instead of the main CTA. You fix this one simple problem, and boom—sales increase by 15%. But that’s not all—Plerdy analytics dives deeper into your website’s performance. Reports like Click Segments Percentages show clicks hidden in dynamic website elements, so you can optimize even sliders and pop-ups. Scroll Depth analytics reveal exactly where visitors stop scrolling, helping you put key messages upfront. With Revenue and Quantity of Sales reports, Plerdy clearly identifies which webpage elements actually drive your website’s sales, giving actionable insights beyond basic metrics.
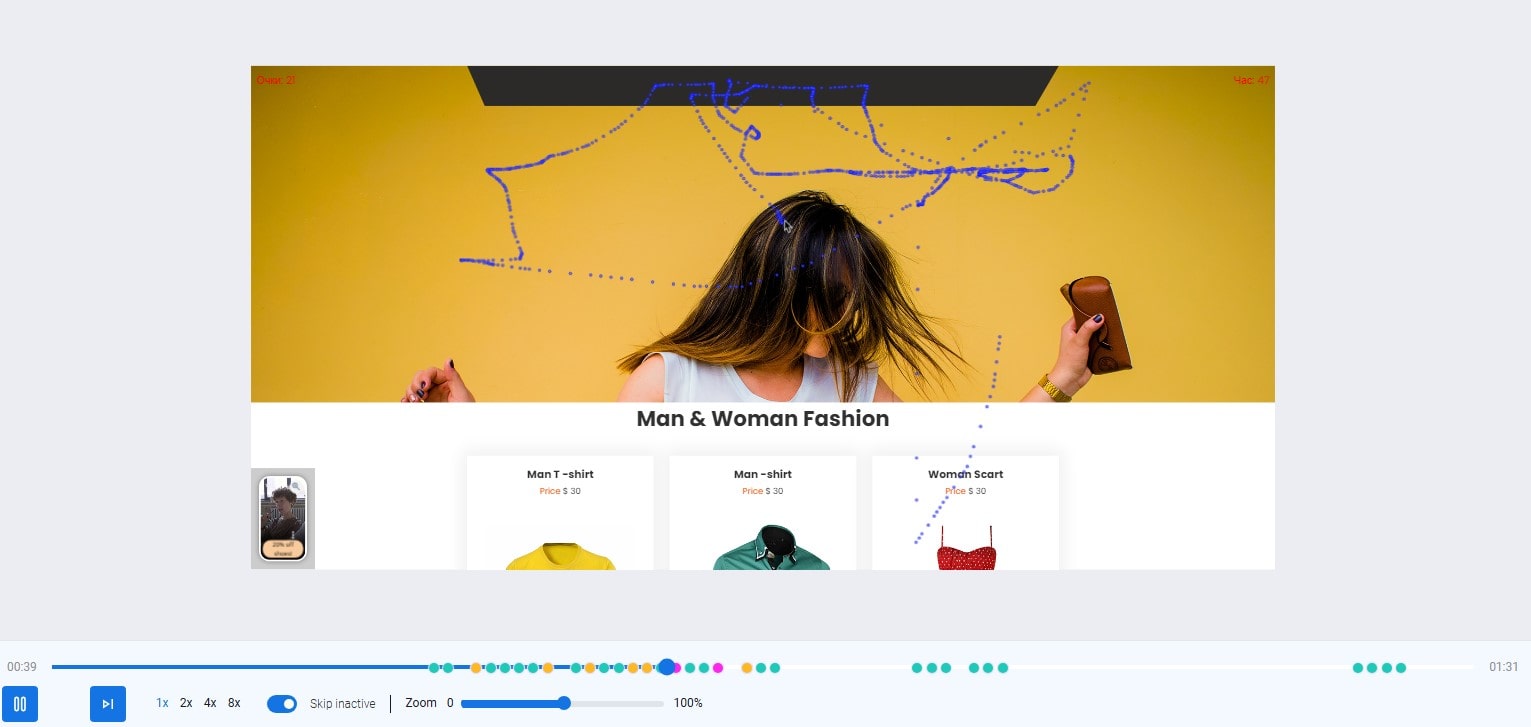
- Session Replay: Remember ever feeling frustrated on a slow-loading website? (We’ve all been there.) Plerdy’s session replay records real user behavior, showing clearly how your visitors move through the website. You’ll quickly spot frustration points—those moments visitors angrily click ten times on your broken checkout button. Fix it, and you save sales immediately. To get started, simply add the Plerdy recording code on your website pages, or select specific URLs. Easily customize your analytics rules—track visitors from different countries or set session length rules. Plerdy even integrates smoothly with your CRM, helping you track individual users by ID. Analyze short sessions to identify issues quickly, and use longer session analytics to find hidden website bugs. With Plerdy metrics, your team can effortlessly share video sessions, add comments or tags, and collaborate on website improvements in real time.
Quick Comparison: Traditional Metrics vs. Plerdy Analytics
| Type of Metrics | Traditional Metrics (Google Analytics) | Plerdy Analytics for Your Website |
|---|---|---|
| Traffic Information | Basic counts only | Detailed user behavior analytics |
| User Interaction Insights | Very limited insights | Clear click heatmaps & user journey |
| Conversion Problems Detection | Not direct, only guessing | Pinpoint exact problems instantly |
| Customer Frustration Analytics | None | Session replay clearly identifies it |
Actionable Strategies to Get the Most From Plerdy Analytics
Okay, let’s get practical now—how exactly can Plerdy website analytics help your website perform better? Here are some proven strategies that really work:
Improve Conversion Rates on Landing Pages
Imagine your website landing page receives good traffic, but traditional metrics only show a sad 1.5% conversion rate. You’re scratching your head—why so low?
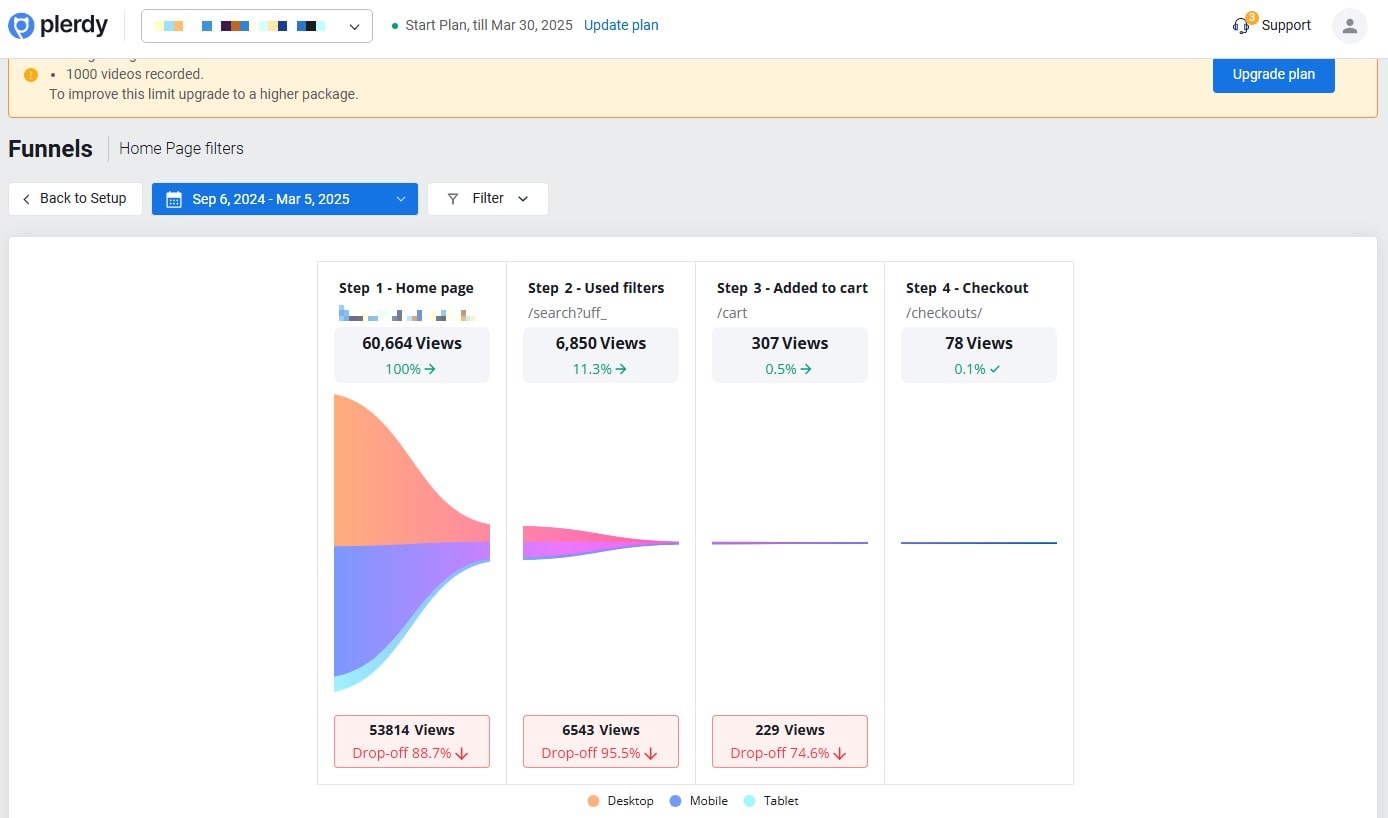
With Plerdy’s website funnel analytics, you quickly spot that visitors never scroll far enough to see your main offer. Maybe your “Sign Up” button hides at the very bottom. Move it higher based on this analytics insight, and your conversions jump to 3%. Easy money, easy improvement.
Optimize Content for Better User Engagement
Let’s say you produce amazing website content regularly, but analytics shows visitors leave too soon. Google Analytics only says your bounce rate is high. Big surprise—not really helpful, right?
Using Plerdy analytics, you can see exactly how far visitors read. Maybe your website visitors lose interest after your super-long intro. Shorten the intro or add engaging images exactly where they drop off, and watch your engagement analytics numbers improve by 25% in no time.
Solve Website User Frustrations Quickly
Here’s another easy example: You sell stylish sneakers. Traditional metrics show website visitors leaving your cart page suddenly—but why? Plerdy’s session replay shows clearly that visitors keep clicking “Checkout,” but the button isn’t working. Fix it quickly, and boom, website sales instantly jump. That’s exactly how analytics should work—solving real website problems.
Why Successful Companies Choose Website Analytics (Like Plerdy)
Have you ever wondered why top brands like Amazon or Airbnb dominate the internet? They never rely only on basic website metrics. They go deeper, tracking exactly what website visitors do. Jeff Bezos always says, “Obsess over customers.” But how can you obsess without analytics that tell you exactly how customers use your website?
With Plerdy, you don’t guess—you know. You easily identify website problems, quickly fix them, and grow faster than competitors stuck using old-school metrics.
How Plerdy Analytics Actually Saves You Money (And Impresses Your Boss)
Ever spent big money on website redesigns only to see zero improvement? It hurts, right? But imagine if you could show clear analytics data to your boss: “Hey, after we spent $4,000 fixing website problems that Plerdy clearly identified, our monthly sales jumped by $9,000.” That’s exactly what makes analytics powerful—not just numbers, but clear, actionable solutions that grow your business.
Easy Tips to Get Started with Plerdy Analytics Right Now:
- Check heatmaps weekly—see exactly where visitors click most, and optimize quickly.
- Run session replays monthly—fix checkout errors or broken buttons instantly.
- Track your funnel analytics regularly—understand exactly where visitors drop off your website and why.
These are super easy and will dramatically improve your website performance.
Final Thoughts: Why Choosing Plerdy Gives Your Website the Ultimate Advantage
Alright, here’s the quick summary if you scrolled straight down (I do it too sometimes):
Traditional metrics are okay—but they don’t show exactly why your website struggles. Plerdy’s advanced analytics, heatmaps, funnel analytics, and session replays provide clear insights that traditional tools simply can’t.
You’ll stop guessing about your website problems. You’ll know exactly how to fix them. And your competitors, still stuck with outdated metrics, will wonder how your website improved so quickly.
Ready to see the difference yourself? Try Plerdy analytics and turn your website into a powerful conversion machine today.