Starting a user-friendly and UX-based website calls for free and subscription-based heatmap tools. Perhaps you personally tested the usability of a website. Interface evaluation thus depends on various presumptions. Many times, we rely on our own experience and believe others see the material the same way. Thus, knowing the behavior of website users is difficult. Why does most consumers ignore a big free offer banner? Why do some possible customers leave the website without a convincing CTA? Understand visitor behavior starting with a free Plerdy heatmap. It allows you to visit the website as a user. Let us walk over how to apply a free heatmap tool for your website.

Why Do You Need a Website Heatmap Tool?
Free and subscription-based heatmap tools help maximize the efforts of marketers, SEO consultants, UX/UI designers, content managers, and everyone else connected to online business. These tools give quick understanding of the general state of a website, therefore helping you to:
- Track user behavior to learn which online components—buttons, CTAs, banners, etc.—draw attention to and which are unproductive.
- Create a website anchored on real-time free testing of any modifications.
- Use scroll depth data showing when consumers stop reading an internet page to help to improve the content’s quality.
- Look for non-clickable items to turn into clickable ones.
You run a great risk losing a lot of time and money on ineffective online marketing strategies without free heatmap tools. The heatmap program offers precise statistics and testing tools to enable you to reach the goal on the first try.
How to Use Free Heatmap Tools to Improve Your Website
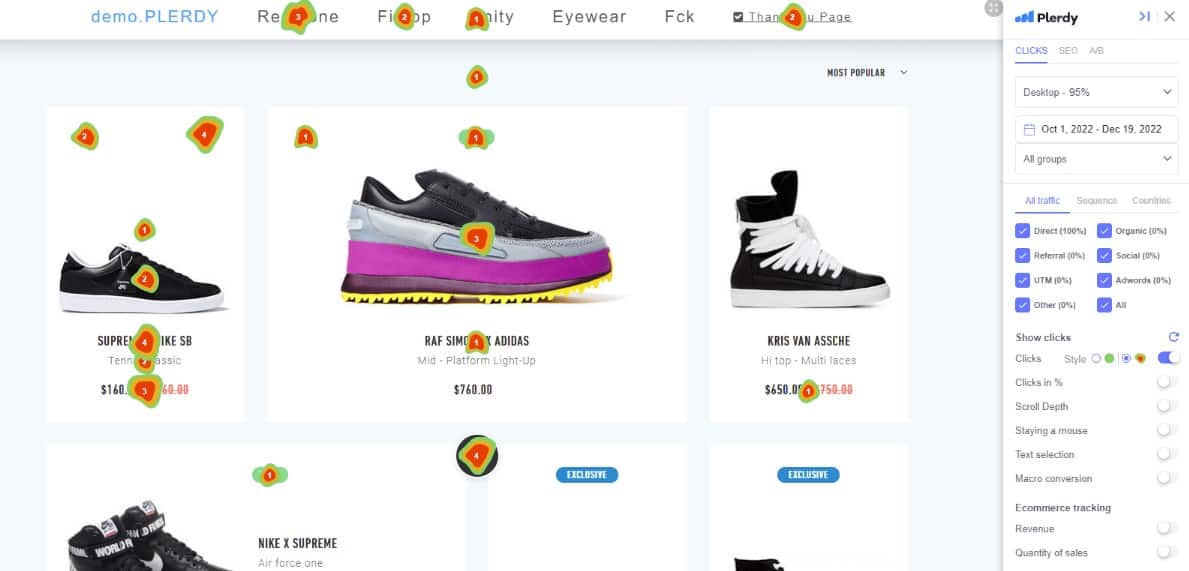
One straightforward idea drives the Internet: users have to receive what they want right away. It begins with Google Search, which, depending on keywords, links, and a variety of other criteria ranks the most relevant internet results at top. It continues with every website that must have the proper location of menus, buttons, CTAs, links, contact information, etc.
While Google Search depends on intricate algorithms, a regular marketer or owner of a website might make advantage of free heatmap tools. This program helps you to grasp what may be changed by displaying a realistic image of user behavior on website pages. Using a free heatmap tool, for instance, you may observe users clicking an inactive element hoping to perform the desired activity. The element fails, hence people could be dissatisfied with their experience. Turning an object into a button will help it to be clickable, therefore lowering the bounce rate brought on by certain design flaws. The free heatmap tool will later indicate whether the suggested adjustments have made the conditions better.
The same applies to other items uploaded on the website. Free heatmap tools let designers test the pages and ensure the selected color, size, font, or position doesn’t irritate or confuse online users. Free heatmap tools thus enable you to design a website that meets the essential needs of the target audience.
Besides, you will be able to improve the caliber of the internet material. Most free heatmap applications have a scroll map feature to track user page scrolling distances. This statistic shows a real enthusiasm for the published material. It’s worth pushing a long article’s ending CTA up if, for instance, most people fall short of it. You should also think about reorganizing the piece, including a content plan for improved navigation, or dividing it.
At last, by bettering your website design, free heatmap tools assist you raise conversion rates and sales. Good usability and simplicity of use inspire users to order, join a subscription, read a paper, or do another required action.
How Do I Start Working with Plerdy Heatmap?
Your one-stop shop for all UX and SEO related concerns is Plerdy. Add the Plerdy heatmap tracking code to your website to get running in no time. This crucial phase will enable Plerdy to gather user interaction data and offer insights to enhance the user experience of your website and stimulate natural traffic increase. Focus not on site speed; our staff has you covered. Just copy and paste the special tracking code before the </body>. element. Select your favorite installation tool and begin to watch data flowing into your Plerdy account. See our troubleshooting guide or call support if you run across any problems. Start optimizing Plerdy right now!
How to Set up Heatmaps?
Using Plerdy, a free heatmap tool, unlock user insights, enhance user experience, and optimise your website. Just a few clicks will create heatmaps for the most visited pages of your website. Let Plerdy manually add any URL to the list or automatically display you the most often visited pages depending on data collecting. Once configured, you will be able to examine heatmaps and base decisions on data to improve your website. Get going right now to see how great your website is!
How to Analyze Heatmaps?
Using Plerdy’s free heatmap tool can help you to gain insightful knowledge about user activity on your website. Examine mouse motions, click count, scroll depth, and more to learn what users enjoy and what irritates them. Use the facts to guide your decisions on content organization, CTA positioning, and website design. Sort the information to delve further into particular visitor groups and behaviors. Plerdy’s dynamic, accurate, and simple to use heatmaps help you to grasp user interaction on your website and enable you to make it work for you.
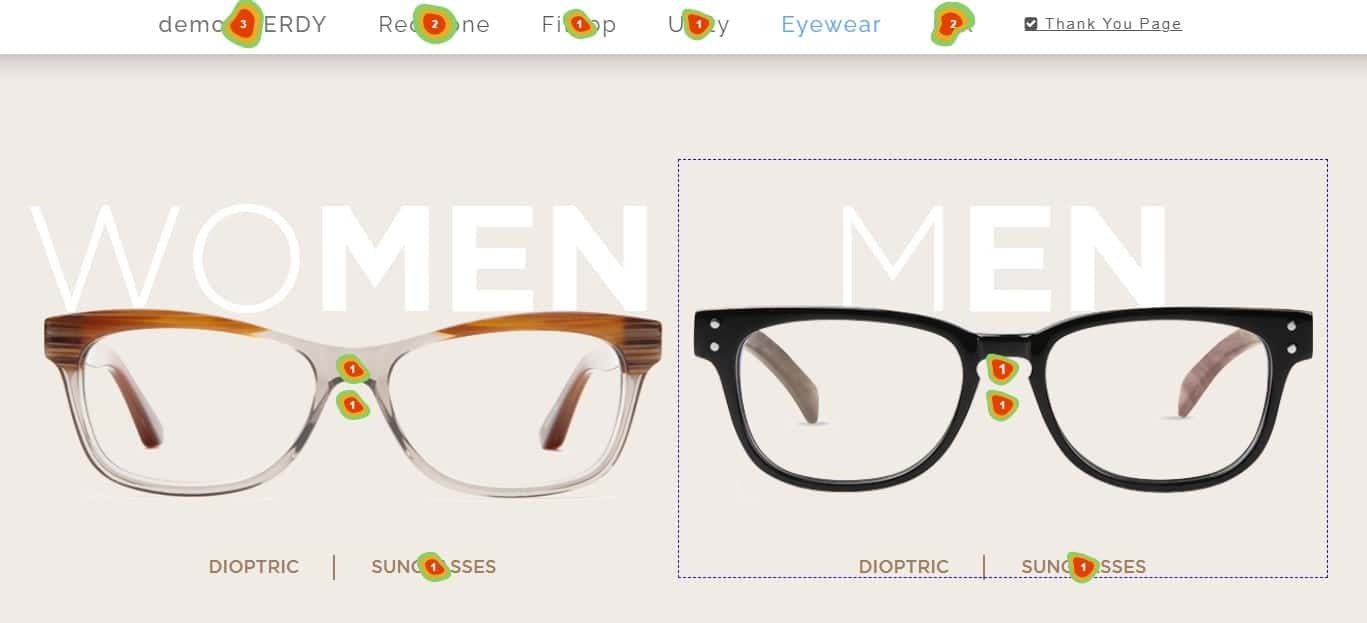
How to Filter Data for Heatmaps?
Using this free heatmap tool on your website, filter like a master! Based on device kinds, traffic channels, click sequences, countries, and user groups, this thorough video will walk you through how to examine your website data. Gain understanding of visitor behavior and enhance their encounter. Use this free heatmap tool to maximize your website exclusively with Plerdy! View the video for further information.
Plerdy: Practical Benefits of Free Heatmap Tools
Comments and suggestions from our users are always much valued. This method lets us gather useful data for our free and subscription-based heatmap tools to be improved even more.
Among the main measures of Plerdy’s heatmap effectiveness are the success tales of our clients. Maintaining contact with our partners helps us to understand the useful advantages of our free website heatmap tools.
Thus, based on user experience of Plerdy, we have identified five primary reasons why free heatmaps should support e-commerce initiatives.
1. Plerdy Free Heatmap Tool Helps Choose the Right Interface
The design of the website ought to be absolutely flawless and most efficient. Regarding the UI of an online store, what does “right” mean? First of all, it indicates that every element of a website serves the designated purposes and is in correct orientation. Review the selected design or its particular components if some of the buttons, fields, banners are not clickable.
The successful design of an online store ought to consider current norms. Standard navigation and button locations help visitors of websites engage much more easily. Besides, any fresh (even amazing) ideas should always be also tested. Some of the design features may be superfluous during such free tests.
For instance, we found mistakes in the design of our client. The managers of the site just missed this error for more than a year.
This design included a useless little hamburger button. Most likely, it stayed there from a responsive form:
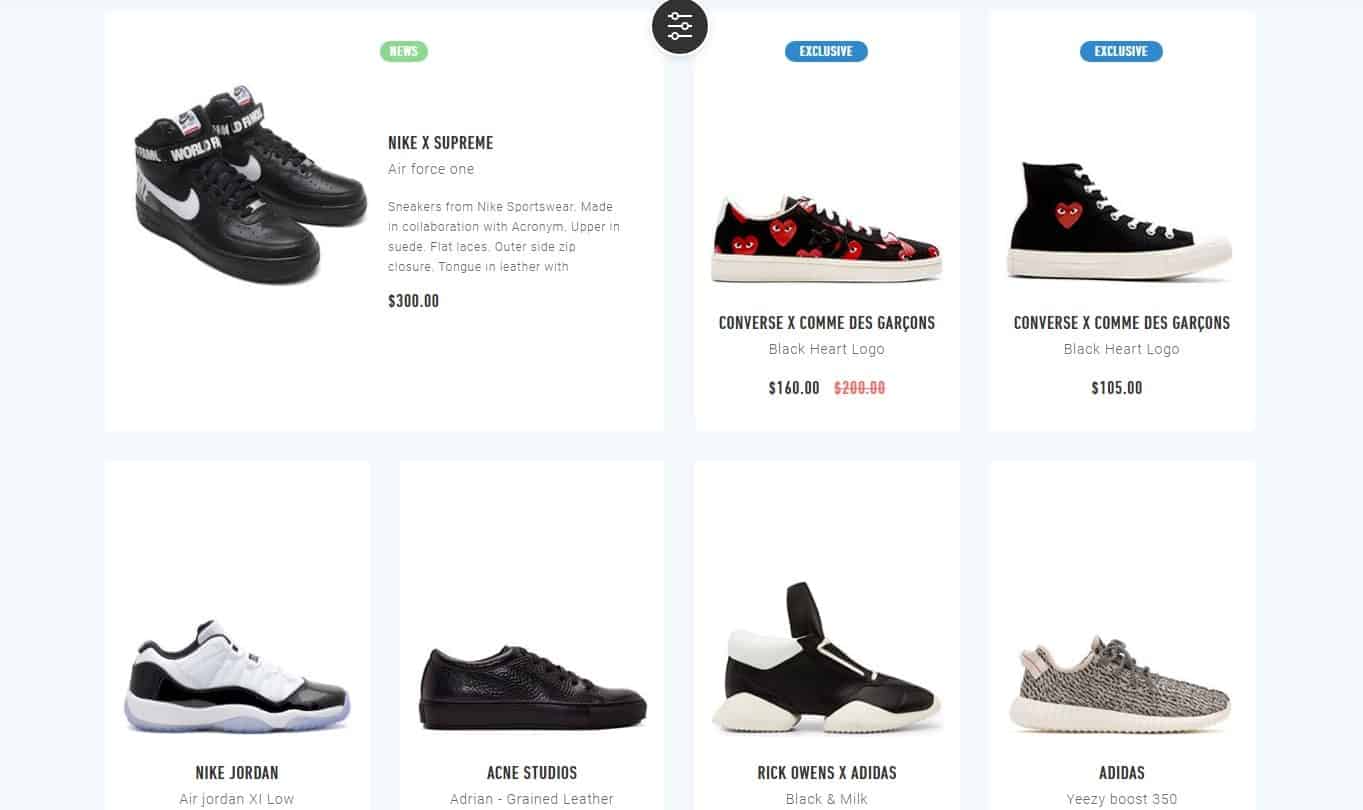
Those visiting wanting to access the hidden menu clicked on it 13 times during one month only:

Modern design also heavily relies on such a fresh psychological phenomenon as “banner blindness”. Users have learnt to ignore or skip advertising ads. A body uses this reaction as its defense mechanism. Every day we come across hundreds of offers to purchase anything, thus we learn to overlook them.
Here is a picture of a banner that nobody clicked on half a year:
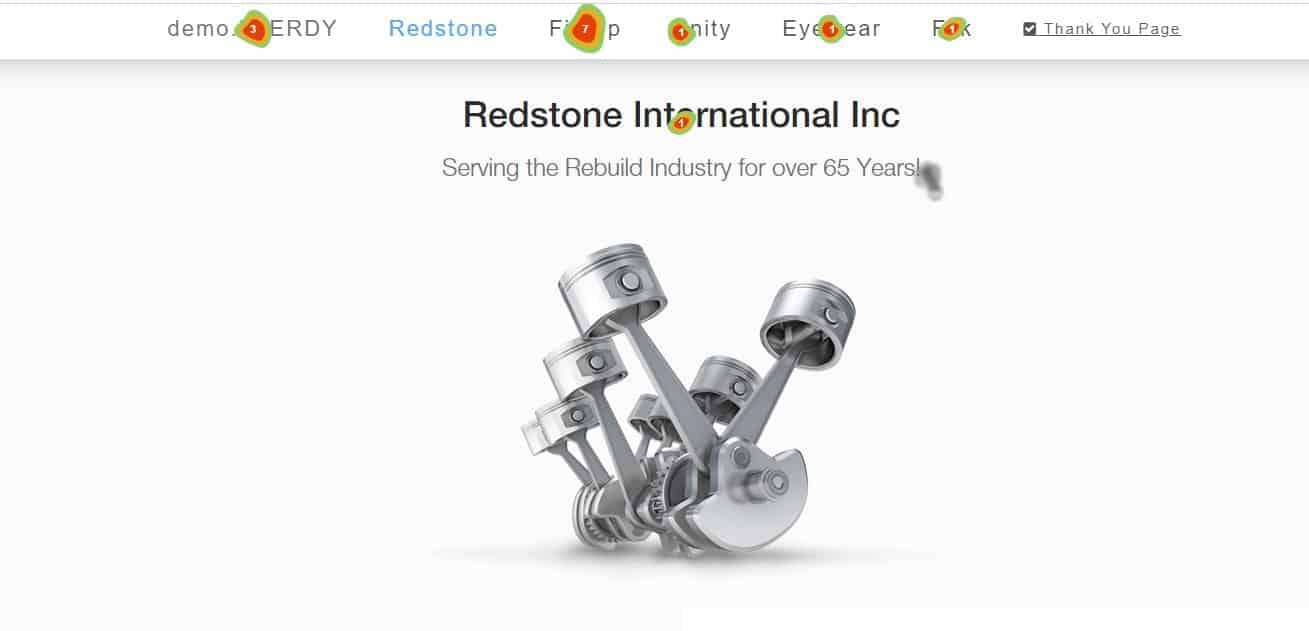
The heatmap on Plerdy’s online domain reveals user impressions of a given banner, therefore optimizing its efficacy.
2. Plerdy Free Heatmap Tool Shows What Content is Popular on the Website
The free click heatmap clarifies the most often used content among your visitors.
It is well recognized that visitors’ curiosity in a website depends on the quality of the material. While analytical tools (like Google Analytics) let one determine the popularity of a website or certain of its pages, click heatmaps alone allow one to examine the interface and page contents.
By the way, some research on user behavior have shown the useful advantages of F-shaped content.
Important information should always be placed top left since a good portion of the world reads text from left to right and from top to bottom:

Data on scroll depth reveals how much of the text people consume. This knowledge helps you decide where to find calls to action or banners most likely. For instance, some of the pages on the blog of an online retailer are read down to the finish (scroll rate is 60–80%).
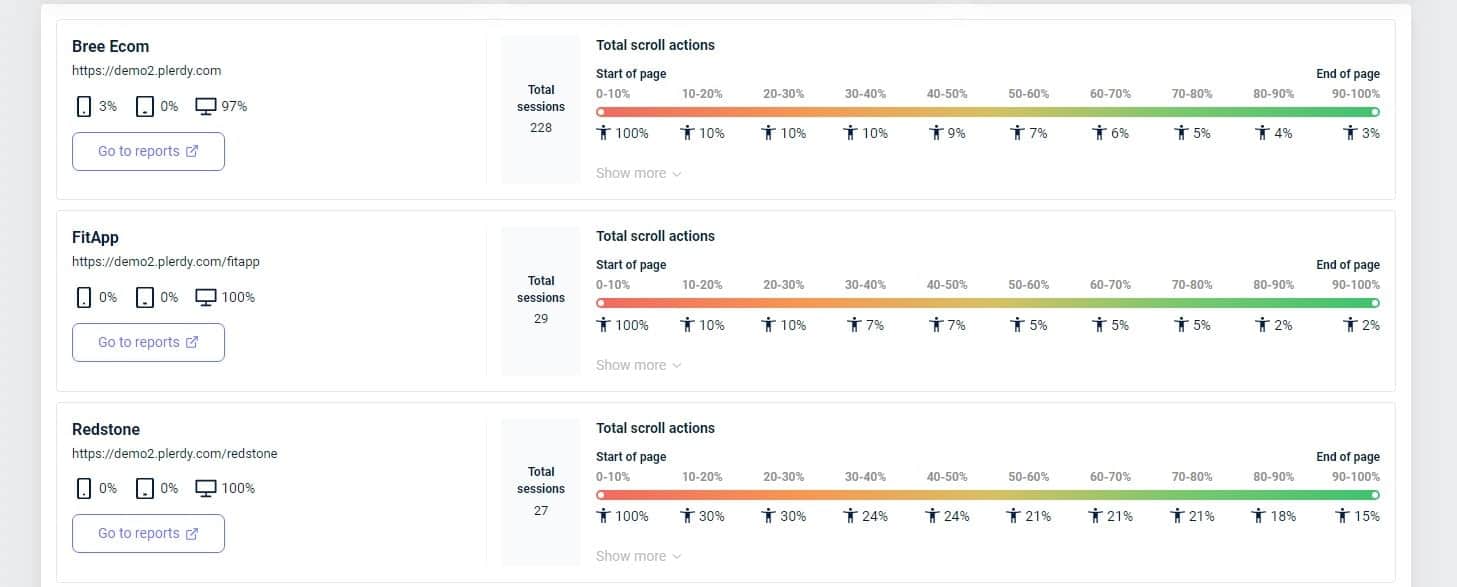
Other sites, though, hardly show 20% of scrolled. We have so advised this store to rewrite the visitor-related articles, but we fail to get their attention.
3. Plerdy Free Heatmap Tool Segments an Audience by Device Type
Do you know the differences in user behavior between those opening a website on a laptop and a smartphone? If not, you lack the whole picture needed for a usability audit.
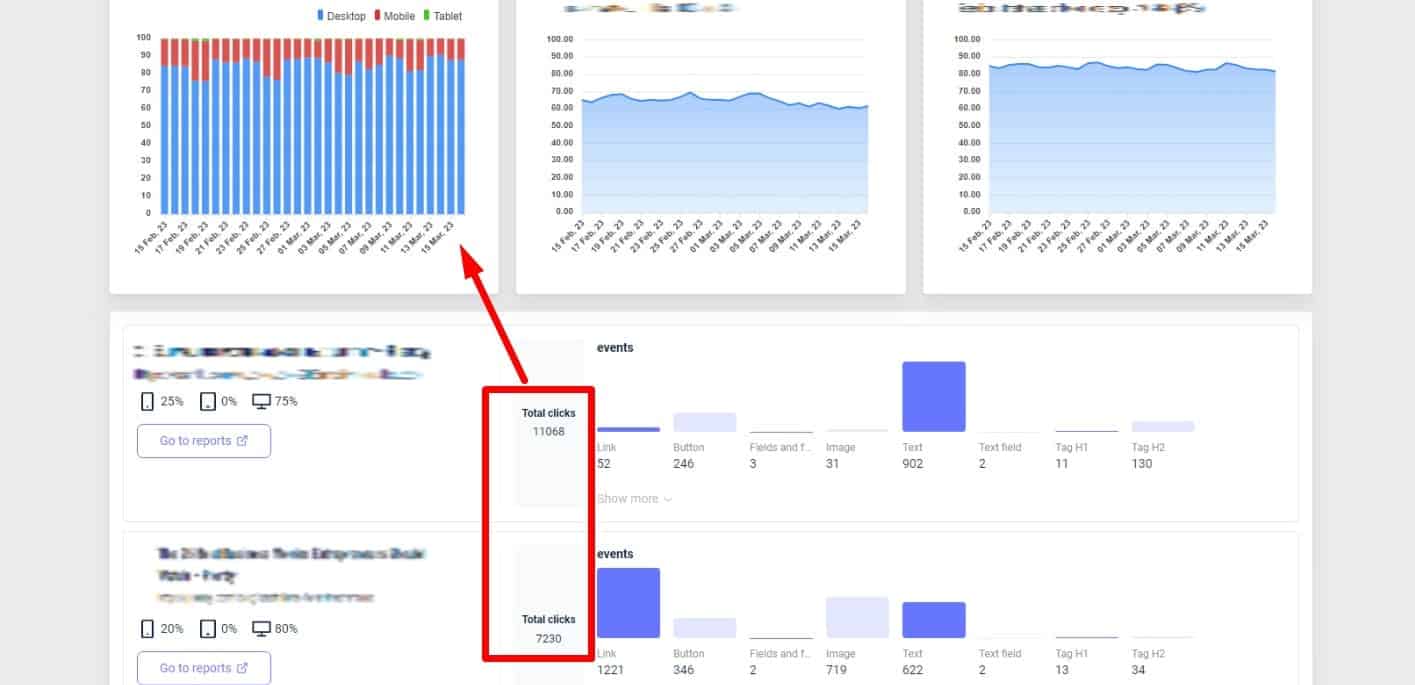
Google Analytics links page visits to device type, however Plerdy heatmap reveals how individuals engage with the viewed site:

The blue represents computers; the red curve displays clicks on smartphones, the green curve on tablets. Plerdy heatmap can gather 99% accurate click data from more than 15 various screen resolutions.
The data split by device type reveals the ratio between several segments and the click count on page elements:
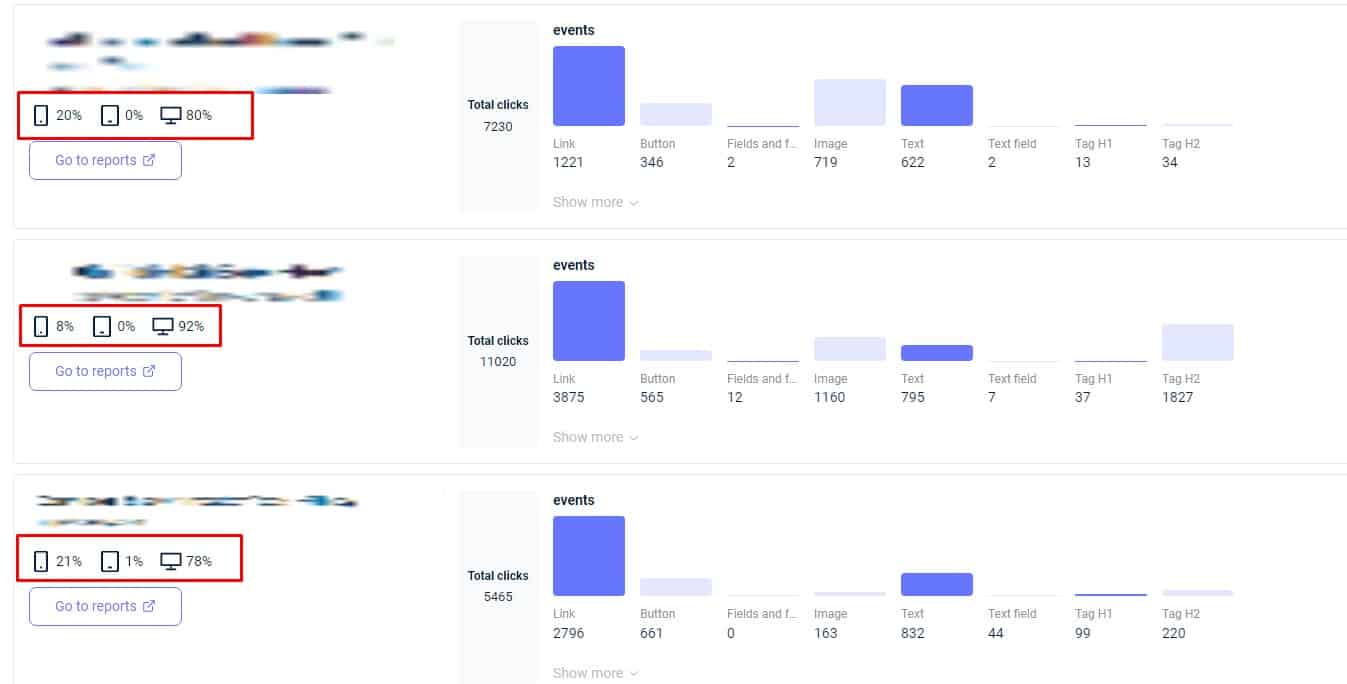
4. Plerdy Free Heatmap Tool Shows What Images Attract the Most Attention
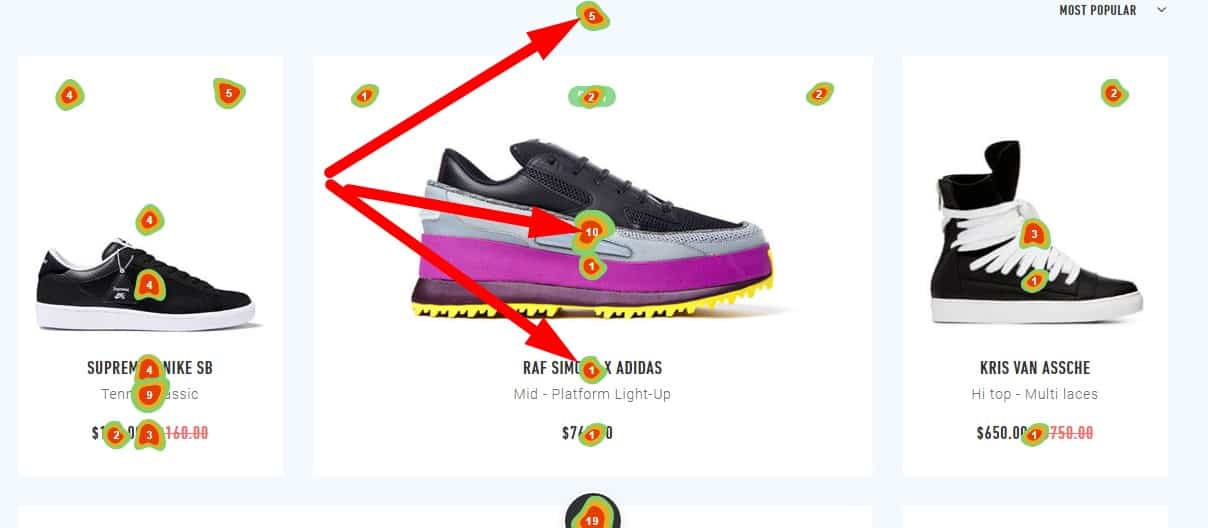
The heatmap will help you to identify which pictures on your website should be replaced and which are a good fit. This is particularly relevant to internet retailers featuring a lot of vivid product photos.
Every picture on a website has to either sell or draw interest. You should thus constantly add quality and pertinent images.
On category pages, the website heatmap can highlight the elements with most and least clicks:
5. Plerdy Free Heatmap Tool Helps Reduce a Bounce Rate
On your website, do all calls to action work? If you’re not sure, use heatmaps to see whether a link or a button with the offer to buy items is conveniently positioned and has the suitable color and size. Minimal user activity can point to a problem.
TechWyse’s studies have shown how location of items, colors, and sizes affect a bounce rate. CareLogger also conducted research showing that well selected button colors can raise CTR by 34%.
Analyzing a third-party website using the Plerdy heatmap, we have identified the button with a quite poor CTR:

Online users more commonly click on the name of a product instead of choosing the button.
We have so volunteered to do an A/B test to select the optimal button color and product name font.
In the same project, a page requiring too many sections needs to be more coherent:
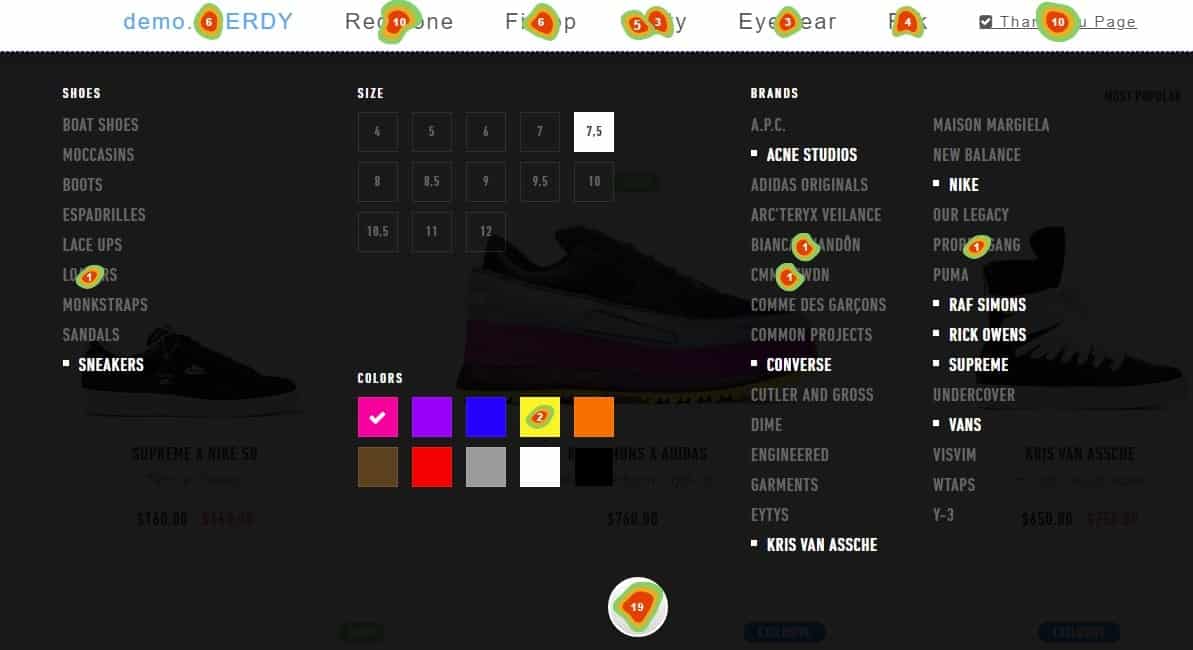
One important navigation tool is a site menu. Its study can yield some quite important results. Analyzing 3-month heatmap data, for instance, helps you identify areas of the desktop version consumers visit more frequently.
Separately collected is the general click data dispersed between pages and their most popular elements:
Other 4 Free Heatmap Tools
Do low engagement and conversion rates on your web pages irritate you? Heatmap tools will help you to raise the performance of your website!
Understanding the behavior of the visitors of your website requires knowledge of heatmap tools. Heatmaps let marketers and web developers see where users click, hover, and scroll across a web page. This knowledge will help them to enhance the design, hence raising involvement and conversion rates.
The top 4 free heatmap applications now on the market are listed below:
| Tool Name | Market | Explanation |
| Contentsquare | Retail, Apparel & Fashion | Contentsquare offers an intuitive technology that reveals customer behavior and transforms your business. 49% of its users are from the Enterprise market segment. |
| Glassbox | Financial Services, Retail | Glassbox empowers organizations to create frictionless digital journeys for their customers. 68% of its users are from the Enterprise market segment. |
| Hotjar | Marketing and Advertising, Computer Software | Hotjar provides Product Experience Insights that show how users behave and what they feel strongly about, so product teams can deliver real value to them. 51% of its users are from the Small-Business segment. |
| Smartlook | Computer Software, Marketing and Advertising | Smartlook is an analytics solution that answers the “whys” behind your users’ actions. 86% of its users are from the Small-Business segment. |
These heatmap tools offer insightful analysis of how users of your website interact, which helps you to make wise decisions enhancing engagement and conversion rates. There’s a heatmap tool suitable for you regardless of your position as enterprise marketer or small business owner!
FAQ: Free Website Heatmap Tool
1. What is a website heatmap tool?
A heatmap for a website is a graphic depiction of user interaction on that website. It logs where people click, scroll, or hover their mouse to help you better know how they negotiate your website. Designing the website, optimizing user experience, and raising conversion rates all depend on this information.
2. Why should I use a free heatmap tool?
By means of a free heatmap tool, you can acquire insightful analysis of user activity without any initial outlay. It lets you know which parts of your website get attention and which go overlooked. This knowledge helps you to decide how best to maximize your site, thereby increasing user involvement and reaching corporate objectives.
3. How do I set up a heatmap tool like Plerdy on my website?
Plerdy’s heatmap tool may be set up quite easily. Your website should have the Plerdy tracking code added by you. This can be accomplished by pasting the code straight before the HTML tag for your site. Plerdy will start gathering user interaction data once it is set in place, enabling you to create heatmaps and base decisions on data to enhance your website.
4. What kind of insights can I gain from using a heatmap tool?
A heatmap tool offers information on user behavior including which buttons users click, how far users scroll on a website, and which features users overlook. These revelations enable you to better satisfy customer expectations and raise conversion rates by optimizing content placement, enhancing call-to- action buttons, and polishing general website design.
5. Can I segment data in a heatmap tool?
Indeed, heatmap like Plerdy let you segment and filter data depending on many parameters such device kind, traffic source, geographical region, and user behavior. This function guarantees a more individualized and efficient user experience by allowing you customize your website’s look and content to particular audience segments.
6. How does a heatmap tool help in reducing bounce rates?
Heatmap data analysis helps you find regions of your website where people are becoming bored or frustrated, so increasing the bounce rates. Key element placement, page layout optimization, and interactive feature usability improvement will help to greatly lower bounce rates and extend user engagement.
7. Are there other free heatmap tools available besides Plerdy?
Indeed, Hotjar, Smartlook, Glassbox, and Contentsquare are among the various alternative free heatmap applications accessible. Every instrument has unique advantages and characteristics; so, you can select the one that most meets your particular demands and objectives.
In conclusion
Optimizing and customizing the user experience on your website is much enhanced by using a heatmap tool. Plerdy allows you to quickly spot consumer behavior on your website and guide actions to raise the general brand performance. There’s no excuse not to try this tool and see the outcomes for yourself, given the choice to start with a free trial or try a Plerdy demo. Creating a graphic depiction of customer interactions helps you to respond to inquiries and request to improve the appeal and coverage of your website. Therefore, if you believe that the greatest approach to draw conclusions is an actual result, start your heatmap adventure right now and witness the changes personally!
