


You want fast answers, not finance poetry. This ROI calculator helps you check an investment before you burn budget—or backtest an old one to see if it actually paid off. Drop simple numbers, get ROI, then compare options apples to apples. Use it when a boss ping arrives or when Plerdy, Google Sheets, or QuickBooks is open and you need clarity now. The goal: make an investment choice in minutes, not weeks. If the ROI looks weak, the calculator shows it. If the ROI sings, lock the investment and move. If you need to test ideas fast, this return on investment calculator lets you check profit before spending real money.
Quick Definition & Formula
ROI In One Sentence
ROI tells you how much profit you get for every $1 of cost, so you judge an investment fast. With a calculator you see ROI as a clean percent, which helps compare one investment to another and decide with less drama. This investment ROI calculator works well for campaigns, startups, or SaaS projects when you want quick answers without spreadsheets.
Simple ROI Formula
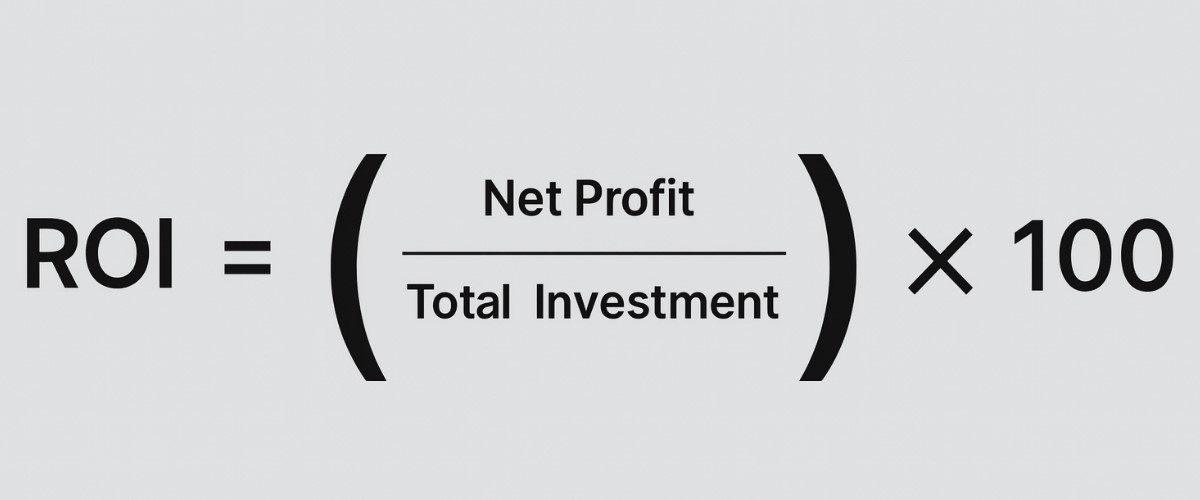
Use this: ROI = ((Gain − Cost) / Cost) × 100%. Example with money: if an investment costs $8,000 and returns $12,000, ROI = (($12,000 − $8,000) / $8,000) × 100 = (4,000 / 8,000) × 100 = 0.5 × 100 = 50%. The calculator shows the same percent and keeps rounding clear. Many teams use a free ROI calculator before meetings to confirm their project math is realistic.
Annualized ROI In One Line
Annualized ROI turns total ROI into a per-year rate for fair comparison across different holding periods. If ROI is 50% over 2 years, annualized ROI = √1.5 − 1 ≈ 0.2247 = 22.47% per year, useful when investments run on different clocks. Among many options, this tool feels like the best ROI calculator because it balances simplicity with accuracy.
How The ROI Calculator Works (Inputs, Outputs, Timeframe)
Inputs You Provide
You drop simple stuff, and the calculator does the hard math. This keeps ROI fast and honest for any investment you test.
- Amount invested in $ (round to whole dollars if you want).
- Amount returned in $ (projected or actual; keep taxes in mind).
- Dates (start–end) or holding period in years/months.
- Optional contributions (monthly/quarterly) and fees (platform, trading, ad spend).
- Tool stack examples: Plerdy, Google Sheets, QuickBooks, Shopify export.
Even a small business return on investment calculator can handle these same inputs to track ad performance or sales growth.
Outputs You Get
The calculator turns inputs into clean signals, so you can compare one investment to another without drama.
- Gain in $ = returned − invested (rounded to nearest dollar).
- ROI % = (Gain ÷ Cost) × 100, shown to 2 decimals.
- Annualized ROI % appears when you add dates or holding period.
- Length held in years (decimal), so 18 months → 1.5.
- Quick sanity: 8,000 → 12,000 means ROI 50.00%.
If your project is online, a website ROI calculator helps you see how traffic, leads, and sales affect profit in real time.
Timeframe & Annualized ROI
Same ROI can tell different stories when time changes. Annualized ROI normalizes results per year, so a 50% win in 2 years (~22.47%/yr) doesn’t look equal to 50% in 6 months (~122.47%/yr). This keeps the calculator fair across uneven timelines. That’s where a return on investment ROI calculator keeps math consistent even across different project durations.
ROI Vs. Annualized ROI: When Each One Is Right
Same ROI, Different Time
Two investments can show the same ROI, but time changes everything. A 50% ROI in 6 months is not the same as 50% over 3 years. Your calculator shows a clean percent; the clock shows reality. For fast checks in Plerdy or Google Sheets, always confirm the holding period. It keeps the investment honest when the ROI number feels too shiny.
When To Annualize
Use annualized ROI when you compare any investment with different timelines, rolling contributions, or messy fees. The calculator translates total ROI into a per-year rate, so a fund on Vanguard and a project in Shopify reports can stand on the same field. Now your decision is fair, not noisy. You can also open an online ROI calculator in your browser to compare ad campaigns or product launches side by side.
Mini Comparison Example
You want to compare one-year vs three-year outcomes with the calculator? Do this:
- Enter each investment, add dates, get ROI and annualized ROI for both.
- Check which annualized ROI is higher; confirm fees were included.
- Pick the option that meets your internal hurdle (for example, ≥12% per year) and matches risk you can handle.
It’s easy to calculate return on investment across projects once you have consistent gain and cost numbers.
ROI Formula, Variants & Edge Cases
Base Formula & Rearranging
You want fast math, not pain. The core is ROI = (Gain − Cost) / Cost. If you target a 30% ROI and know Cost, solve Gain = ROI × Cost + Cost. Example: Cost = $10,000 → Gain = 0.30 × 10,000 + 10,000 = $13,000 (rounded to whole dollars). Flip it the other way: if Gain is known and you chase a specific ROI, then Cost = Gain / (ROI + 1). Your calculator keeps the fractions clean and repeatable across any investment test. You can also calculate ROI directly in dashboards like GA4 or Plerdy without switching to Excel.
Taxes, Fees & Operating Costs
ROI gets messy when you forget the small money leaks. Keep the calculator fair by adding real costs to the investment before you press Calculate. Stay consistent between options; otherwise you compare apples and watermelons. Common items to include:
- Trading commissions or brokerage spreads
- Payment processing fees (Stripe, PayPal)
- Platform or SaaS fees (Shopify apps, Plerdy plan)
- Taxes on gains, VAT where relevant
- Maintenance/hosting/infrastructure
- Shipping, storage, fulfillment
- Creative/media production costs
Contributions & Compounding
Many investments are not one-and-done. You deposit every month, the balance grows, and ROI shifts. Use the calculator’s growth mode for recurring contributions; it shows total contribution and how compounding changes the story. Example: $500/month for 24 months at a steady gain path can turn a flat 20% ROI into very different annual outcomes depending on timing. For clean comparisons, enter the same schedule for each investment and review annualized ROI before you commit. An ROI calculator online makes it easy to check results anytime without installing extra software.
Worked Examples Across Use Cases
Stocks/ETF Example
You put $5,000 into a Vanguard S&P 500 ETF and exit at $6,250 after 14 months. The calculator shows ROI = (6,250 − 5,000) / 5,000 = 0.25 = 25%. Annualized ROI converts total return to per-year: (1 + 0.25)^(12/14) − 1 ≈ 21.0%/yr. Fast read: the investment beat many savings products by a wide gap. Keep it simple—same method if you track in Fidelity or Google Sheets. The calculator makes the math calm when the market feels noisy.
Real Estate Example
Buy a condo for $300,000; sell for $345,000 after 2 years. Real costs matter: taxes/maintenance/closing total $9,000. Net gain = 345,000 − 300,000 − 9,000 = $36,000. The calculator shows ROI = 36,000 / 300,000 = 12%. Annualized ROI ≈ √1.12 − 1 = 5.83%/yr. This investment looks fine, but you see how fees eat return. Put expenses in the calculator every time; otherwise the ROI story is too sweet. Zillow can show price history, but your calculator keeps truth.
Marketing Campaign Example
Ad spend $12,000 (Meta Ads Manager), tools $600 (Plerdy, email), creative $1,400 → total investment $14,000. Revenue $56,000 with 40% gross margin → gross profit $22,400. Net gain = 22,400 − 14,000 = $8,400. The calculator gives ROI = 8,400 / 14,000 = 60%. Campaign ran 3 months → annualized ROI math only: (1 + 0.60)^(1/0.25) − 1 = ~555%/yr (strong on paper; assumes reinvestment). Use attribution carefully in GA4; measure profit, not vanity metrics. The calculator keeps decisions honest. A simple ROI calculator shows how your ad spend turns into actual revenue without deep finance skills.
ROI Benchmarks, Risk & Decision Rules
Typical Ranges (High-Level)
Use benchmarks as road signs, not promises. Over long horizons, many investors report stock market returns near 7–10%/yr (broad U.S. indexes), investment-grade bonds around 3–6%/yr, and residential real estate near 3–6%/yr after big swings. Your ROI can be above or below these bands based on entry price, fees, and timing. Run the numbers in the calculator, then compare to a target, not to Twitter hype. Tools you already know—Vanguard, Fidelity, Zillow—help with history; the calculator keeps your ROI honest.
Risk, WACC & Limit Values (LV)
Teams set a minimum ROI using WACC (weighted average cost of capital) or a simple limit value (LV). If WACC is 9%, an investment with 7% ROI destroys value; ≥9% is the baseline. For startups or higher risk, the LV can be 15–25% to cover volatility and execution. Decide the LV first, then test with the calculator. Context matters: cash flow stability, runway, and fees. Plerdy dashboards and GA4 can support the story; the calculator gives the clean percent.
Quick Acceptance Checklist
- ROI ≥ LV or WACC for this investment
- Timeframe aligned; annualized ROI used for comparisons
- Costs complete: taxes, platforms, media, maintenance
- Risk acceptable (drawdown, variance, worst-case)
- Capacity to fund and monitor the investment over time
- Calculator result reproduced by a second pass (no spreadsheet “magic”)
Common ROI Mistakes To Avoid
Wrong Costs, Wrong Outcomes
You push numbers into the calculator and the ROI looks sweet… until the bill arrives. Missing costs destroy truth. Add platform fees, taxes, refunds, and maintenance or your investment report is fantasy. Counting “hearts” on social is not revenue; measure profit. If GA4 shows $56,000 revenue but gross margin is 40%, your gain is not $56,000. The calculator can’t fix bad inputs. Be strict: same cost model for every investment, same period, same rounding rule. Then ROI tells the real story.
Ignoring Time, Cash Flow, Risk
Same ROI can trick you when time and cash move. Annualize to compare fairly, especially when one investment runs 3 months and another 2 years. Test scenarios: base, optimistic, brutal. Cash flow matters too—profit on paper with no cash can still choke the team. Use the calculator, but sanity-check with finance.
- Forgetting to annualize across unequal periods
- Excluding fees/taxes or double-counting revenue
- Using engagement instead of profit for ROI
- Ignoring cash flow timing and refunds
- Skipping scenario ranges (best/median/worst)
How To Improve ROI Ethically
Increase Revenue Side
You push small changes, the ROI moves. Keep the calculator close and test one thing at a time on each investment.
- Smarter pricing tiers; test +5% and watch ROI response.
- Upsell bundles in Shopify or Stripe checkout.
- Lift conversion with Plerdy insights; fix weak pages, then run the calculator again.
Control Cost Side
Costs creep, ROI cries. Your investment gets stronger when you trim waste and lock better terms.
- Audit lifecycle costs: media, tools, shipping, returns.
- Renegotiate SaaS or ad rates; cancel zombie subscriptions.
- Improve ops efficiency; record savings, update the calculator to see the new ROI.
Sometimes, an easy ROI calculator helps you notice which small cuts raise total return the fastest.
Optimize Time & Contributions
Time changes math. A steady deposit plan can make the investment healthier, and the calculator shows it.
- Extend holding period when the ROI per year stays solid.
- Add consistent monthly contributions to power compounding.
- Recheck annualized ROI each quarter; if percent drops under your hurdle, pause and reassess.
Conclusion
You have the tool—use the calculator first, then trust your head. Run ROI for every investment, then annualize so a 50% win in 6 months doesn’t fight a 50% over 2 years. Compare ROI to your LV/WACC (many teams aim 8–12%/yr as a floor), and weigh risk, fees, and cash. Keep the calculator close; rerun ROI when investment costs or revenue change. If the math screams “no,” walk away. If it holds steady, the calculator helps you push the investment at the right speed.
FAQ — ROI Calculator
What does the ROI calculator do?
The ROI calculator estimates return on investment by comparing gain to cost and shows the result as a percentage. If you enter dates or a holding period, it also shows annualized ROI to normalize results per year for fair comparisons between different timelines.
Which inputs should I add to get accurate results?
Enter amount invested, amount returned, and either start/end dates or the total holding period. For best accuracy, include contributions and all relevant costs such as platform fees, taxes, maintenance, shipping, or creative spend. Consistent inputs across scenarios make comparisons valid.
What formula does the calculator use for ROI?
The calculator uses ROI = (Gain − Cost) / Cost. Gain equals the amount returned minus the amount invested, adjusted by any costs you include. Results are shown as a percentage; rounding is applied to two decimals so reports are easy to read and compare.
When should I use annualized ROI instead of simple ROI?
Use annualized ROI when comparing investments with different holding periods. It converts total ROI into a per-year rate, so a 50% gain over 6 months is not treated the same as 50% over 3 years. Add dates or the holding period to enable this output.
Does the calculator account for fees and taxes automatically?
Fees and taxes are not auto-fetched. You should add them into costs before calculating ROI. Include trading commissions, payment processing fees, SaaS subscriptions, ad spend, taxes, and ongoing maintenance. This prevents overstated returns and keeps each comparison consistent and fair.